RSyslog Windows Agent 7.5c Released
Release Date: 2024-10-06
Build-IDs: Service 7.5.0.228, Client 7.4.0.315
Bugfixes |
|
You can download Free Trial Version of RSyslog Windows Agent.
RSyslog Windows Agent 5.0 Released
Release Date: 2018-04-11
Build-IDs: Service 5.0.0.185, Client 5.0.0.263
Features |
|
Bugfixes |
|
You can download Free Trial Version of RSyslog Windows Agent.
RSyslog Windows Agent 4.2 Released
Adiscon is proud to announce the 4.2 release of MonitorWare Agent.
Besides some bugfixes (See Version History for details) a few new features have been added to this minor release. Most important is the ability to use regular expressions as compare operation when filtering properties. Properties can also be converted into IPv4 or IPv6 Addresses now, and the Syslog Priority/Facility can be overwritten in the Syslog Action.
Detailed information can be found in the version history below.
Build-IDs: Service 4.2.0.170, Client 4.2.0.250
Features |
|
Bugfixes |
|
Version 4.2 is a free download. Customers with existing 3.x keys can contact our Sales department for upgrade prices. If you have a valid Upgrade Insurance ID, you can request a free new key by sending your Upgrade Insurance ID to sales@adiscon.com. Please note that the download enables the free 30-day trial version if used without a key – so you can right now go ahead and evaluate it.
RSyslog Windows Agent 3.3 Released
Adiscon is proud to announce the 3.3 release of RSyslog Windows Agent.
This is a bugfixing release with minor feature update.
Most importantly, the Adiscon SNMP MIB now supports messages sizes up to 64k (previous limit was 255 characters). The OpenSSL Library has been updated to 1.0.2h. Bugs were fixed primarily in RELP and syslog forwarding processing. For details please see the change log.
Detailed information can be found in the version history below.
Build-IDs: Service 3.3.152, Client 3.3.235
Features |
|
Bugfixes |
|
Version 3.3 is a free download. Customers with existing 2.x keys can contact our Sales department for upgrade prices. If you have a valid Upgrade Insurance ID, you can request a free new key by sending your Upgrade Insurance ID to sales@adiscon.com. Please note that the download enables the free 30-day trial version if used without a key – so you can right now go ahead and evaluate it.
Using rsyslog to Reindex/Migrate Elasticsearch data
Original post: Scalable and Flexible Elasticsearch Reindexing via rsyslog by @Sematext
This recipe is useful in a two scenarios:
- migrating data from one Elasticsearch cluster to another (e.g. when you’re upgrading from Elasticsearch 1.x to 2.x or later)
- reindexing data from one index to another in a cluster pre 2.3. For clusters on version 2.3 or later, you can use the Reindex API
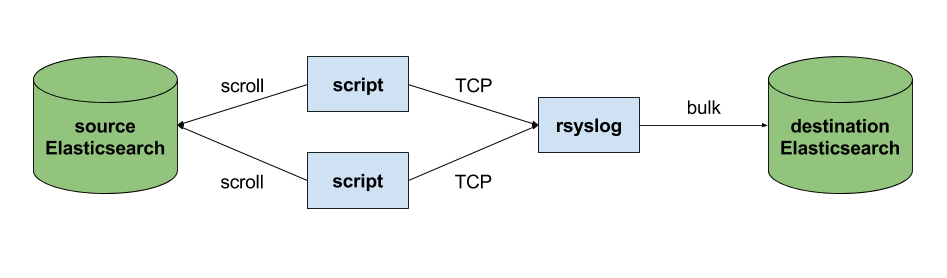
Back to the recipe, we used an external application to scroll through Elasticsearch documents in the source cluster and push them to rsyslog via TCP. Then we used rsyslog’s Elasticsearch output to push logs to the destination cluster. The overall flow would be:

This is an easy way to extend rsyslog, using whichever language you’re comfortable with, to support more inputs. Here, we piggyback on the TCP input. You can do a similar job with filters/parsers – you can find GeoIP implementations, for example – by piggybacking the mmexternal module, which uses stdout&stdin for communication. The same is possible for outputs, normally added via the omprog module: we did this to add a Solr output and one for SPM custom metrics.
The custom script in question doesn’t have to be multi-threaded, you can simply spin up more of them, scrolling different indices. In this particular case, using two scripts gave us slightly better throughput, saturating the network:
Writing the custom script
Before starting to write the script, one needs to know how the messages sent to rsyslog would look like. To be able to index data, rsyslog will need an index name, a type name and optionally an ID. In this particular case, we were dealing with logs, so the ID wasn’t necessary.
With this in mind, I see a number of ways of sending data to rsyslog:
- one big JSON per line. One can use mmnormalize to parse that JSON, which then allows rsyslog do use values from within it as index name, type name, and so on
- for each line, begin with the bits of “extra data” (like index and type names) then put the JSON document that you want to reindex. Again, you can use mmnormalize to parse, but this time you can simply trust that the last thing is a JSON and send it to Elasticsearch directly, without the need to parse it
- if you only need to pass two variables (index and type name, in this case), you can piggyback on the vague spec of RFC3164 syslog and send something like
destination_index document_type:{"original": "document"}
This last option will parse the provided index name in the hostname variable, the type in syslogtag and the original document in msg. A bit hacky, I know, but quite convenient (makes the rsyslog configuration straightforward) and very fast, since we know the RFC3164 parser is very quick and it runs on all messages anyway. No need for mmnormalize, unless you want to change the document in-flight with rsyslog.
Below you can find the Python code that can scan through existing documents in an index (or index pattern, like logstash_2016.05.*) and push them to rsyslog via TCP. You’ll need the Python Elasticsearch client (pip install elasticsearch) and you’d run it like this:
python elasticsearch_to_rsyslog.py source_index destination_index
The script being:
from elasticsearch import Elasticsearch
import json, socket, sys

source_cluster = ['server1', 'server2']
rsyslog_address = '127.0.0.1'
rsyslog_port = 5514

es = Elasticsearch(source_cluster,
      retry_on_timeout=True,
      max_retries=10)
s = socket.socket(socket.AF_INET, socket.SOCK_STREAM)
s.connect((rsyslog_address, rsyslog_port))


result = es.search(index=sys.argv[1], scroll='1m', search_type='scan', size=500)

while True:
  res = es.scroll(scroll_id=result['_scroll_id'], scroll='1m')
  for hit in result['hits']['hits']:
    s.send(sys.argv[2] + ' ' + hit["_type"] + ':' + json.dumps(hit["_source"])+'\n')
  if not result['hits']['hits']:
    break

s.close()
If you need to modify messages, you can parse them in rsyslog via mmjsonparse and then add/remove fields though rsyslog’s scripting language. Though I couldn’t find a nice way to change field names – for example to remove the dots that are forbidden since Elasticsearch 2.0 – so I did that in the Python script:
def de_dot(my_dict):
  for key, value in my_dict.iteritems():
    if '.' in key:
      my_dict[key.replace('.','_')] = my_dict.pop(key)
    if type(value) is dict:
      my_dict[key] = de_dot(my_dict.pop(key))
  return my_dict
And then the “send” line becomes:
s.send(sys.argv[2] + ' ' + hit["_type"] + ':' + json.dumps(de_dot(hit["_source"]))+'\n')
Configuring rsyslog
The first step here is to make sure you have the lastest rsyslog, though the config below works with versions all the way back to 7.x (which can be found in most Linux distributions). You just need to make sure the rsyslog-elasticsearch package is installed, because we need the Elasticsearch output module.
# messages bigger than this are truncated
$maxMessageSize 10000000  # ~10MB

# load the TCP input and the ES output modules
module(load="imtcp")
module(load="omelasticsearch")

main_queue(
  # buffer up to 1M messages in memory
  queue.size="1000000"
  # these threads process messages and send them to Elasticsearch
  queue.workerThreads="4"
  # rsyslog processes messages in batches to avoid queue contention
  # this will also be the Elasticsearch bulk size
  queue.dequeueBatchSize="4000"
)

# we use templates to specify how the data sent to Elasticsearch looks like
template(name="document" type="list"){
  # the "msg" variable contains the document
  property(name="msg")
}
template(name="index" type="list"){
  # "hostname" has the index name
  property(name="hostname")
}
template(name="type" type="list"){
  # "syslogtag" has the type name
  property(name="syslogtag")
}

# start the TCP listener on the port we pointed the Python script to
input(type="imtcp" port="5514")

# sending data to Elasticsearch, using the templates defined earlier
action(type="omelasticsearch"
  template="document"
  dynSearchIndex="on" searchIndex="index"
  dynSearchType="on" searchType="type"
  server="localhost"  # destination Elasticsearch host
  serverport="9200"   # and port
  bulkmode="on"  # use the bulk API
  action.resumeretrycount="-1"  # retry indefinitely if Elasticsearch is unreachable
)
This configuration doesn’t have to disturb your local syslog (i.e. by replacing /etc/rsyslog.conf). You can put it someplace else and run a different rsyslog process:
rsyslogd -i /var/run/rsyslog_reindexer.pid -f /home/me/rsyslog_reindexer.conf
And that’s it! With rsyslog started, you can start the Python script(s) and do the reindexing.
RSyslog Windows Agent 3.2 Released
Adiscon is proud to announce the 3.2 release of RSyslog Windows Agent.
This is a maintenenance release for RSyslog Windows Agent, which includes Features and bugfixes.
There is a huge list of changes, but the most important is the enhanced support for file based configurations.
Also inbuild components like OpenSSL and NetSNMP have been updated to the latest versions.
Detailed information can be found in the version history below.
Build-IDs: Service 3.2.143, Client 3.2.0.230
Features |
|
Bugfixes |
|
Version 3.2 is a free download. Customers with existing 2.x keys can contact our Sales department for upgrade prices. If you have a valid Upgrade Insurance ID, you can request a free new key by sending your Upgrade Insurance ID to sales@adiscon.com. Please note that the download enables the free 30-day trial version if used without a key – so you can right now go ahead and evaluate it.
Connecting with Logstash via Apache Kafka
Original post: Recipe: rsyslog + Kafka + Logstash by @Sematext
This recipe is similar to the previous rsyslog + Redis + Logstash one, except that we’ll use Kafka as a central buffer and connecting point instead of Redis. You’ll have more of the same advantages:
- rsyslog is light and crazy-fast, including when you want it to tail files and parse unstructured data (see the Apache logs + rsyslog + Elasticsearch recipe)
- Kafka is awesome at buffering things
- Logstash can transform your logs and connect them to N destinations with unmatched ease
There are a couple of differences to the Redis recipe, though:
- rsyslog already has Kafka output packages, so it’s easier to set up
- Kafka has a different set of features than Redis (trying to avoid flame wars here) when it comes to queues and scaling
As with the other recipes, I’ll show you how to install and configure the needed components. The end result would be that local syslog (and tailed files, if you want to tail them) will end up in Elasticsearch, or a logging SaaS like Logsene (which exposes the Elasticsearch API for both indexing and searching). Of course you can choose to change your rsyslog configuration to parse logs as well (as we’ve shown before), and change Logstash to do other things (like adding GeoIP info).
Getting the ingredients
First of all, you’ll probably need to update rsyslog. Most distros come with ancient versions and don’t have the plugins you need. From the official packages you can install:
- rsyslog. This will update the base package, including the file-tailing module
- rsyslog-kafka. This will get you the Kafka output module
If you don’t have Kafka already, you can set it up by downloading the binary tar. And then you can follow the quickstart guide. Basically you’ll have to start Zookeeper first (assuming you don’t have one already that you’d want to re-use):
bin/zookeeper-server-start.sh config/zookeeper.properties
And then start Kafka itself and create a simple 1-partition topic that we’ll use for pushing logs from rsyslog to Logstash. Let’s call it rsyslog_logstash:
bin/kafka-server-start.sh config/server.properties
bin/kafka-topics.sh --create --zookeeper localhost:2181 --replication-factor 1 --partitions 1 --topic rsyslog_logstash
Finally, you’ll have Logstash. At the time of writing this, we have a beta of 2.0, which comes with lots of improvements (including huge performance gains of the GeoIP filter I touched on earlier). After downloading and unpacking, you can start it via:
bin/logstash -f logstash.conf
Though you also have packages, in which case you’d put the configuration file in /etc/logstash/conf.d/ and start it with the init script.
Configuring rsyslog
With rsyslog, you’d need to load the needed modules first:
module(load="imuxsock")  # will listen to your local syslog
module(load="imfile")    # if you want to tail files
module(load="omkafka")   # lets you send to Kafka
If you want to tail files, you’d have to add definitions for each group of files like this:
input(type="imfile"
  File="/opt/logs/example*.log"
  Tag="examplelogs"
)
Then you’d need a template that will build JSON documents out of your logs. You would publish these JSON’s to Kafka and consume them with Logstash. Here’s one that works well for plain syslog and tailed files that aren’t parsed via mmnormalize:
template(name="json_lines" type="list" option.json="on") {
  constant(value="{")
  constant(value="\"timestamp\":\"")
  property(name="timereported" dateFormat="rfc3339")
  constant(value="\",\"message\":\"")
  property(name="msg")
  constant(value="\",\"host\":\"")
  property(name="hostname")
  constant(value="\",\"severity\":\"")
  property(name="syslogseverity-text")
  constant(value="\",\"facility\":\"")
  property(name="syslogfacility-text")
  constant(value="\",\"syslog-tag\":\"")
  property(name="syslogtag")
  constant(value="\"}")
}
By default, rsyslog has a memory queue of 10K messages and has a single thread that works with batches of up to 16 messages (you can find all queue parameters here). You may want to change:
– the batch size, which also controls the maximum number of messages to be sent to Kafka at once
– the number of threads, which would parallelize sending to Kafka as well
– the size of the queue and its nature: in-memory(default), disk or disk-assisted
In a rsyslog->Kafka->Logstash setup I assume you want to keep rsyslog light, so these numbers would be small, like:
main_queue(
  queue.workerthreads="1"      # threads to work on the queue
  queue.dequeueBatchSize="100" # max number of messages to process at once
  queue.size="10000"           # max queue size
)
Finally, to publish to Kafka you’d mainly specify the brokers to connect to (in this example we have one listening to localhost:9092) and the name of the topic we just created:
action(
  broker=["localhost:9092"]
  type="omkafka"
  topic="rsyslog_logstash"
  template="json"
)
Assuming Kafka is started, rsyslog will keep pushing to it.
Configuring Logstash
This is the part where we pick the JSON logs (as defined in the earlier template) and forward them to the preferred destinations. First, we have the input, which will use to the Kafka topic we created. To connect, we’ll point Logstash to Zookeeper, and it will fetch all the info about Kafka from there:
input {
  kafka {
    zk_connect => "localhost:2181"
    topic_id => "rsyslog_logstash"
  }
}
At this point, you may want to use various filters to change your logs before pushing to Logsene/Elasticsearch. For this last step, you’d use the Elasticsearch output:
output {
  elasticsearch {
    hosts => "localhost" # it used to be "host" pre-2.0
    port => 9200
    #ssl => "true"
    #protocol => "http" # removed in 2.0
  }
}
And that’s it! Now you can use Kibana (or, in the case of Logsene, either Kibana or Logsene’s own UI) to search your logs!
Recipe: Apache Logs + rsyslog (parsing) + Elasticsearch
Original post: Recipe: Apache Logs + rsyslog (parsing) + Elasticsearch by @Sematext
This recipe is about tailing Apache HTTPD logs with rsyslog, parsing them into structured JSON documents, and forwarding them to Elasticsearch (or a log analytics SaaS, like Logsene, which exposes the Elasticsearch API). Having them indexed in a structured way will allow you to do better analytics with tools like Kibana:

We’ll also cover pushing logs coming from the syslog socket and kernel, and how to buffer all of them properly. So this is quite a complete recipe for your centralized logging needs.
Getting the ingredients
Even though most distros already have rsyslog installed, it’s highly recommended to get the latest stable from the rsyslog repositories. The packages you’ll need are:
- rsyslog. The base package, including the file-tailing module (imfile)
- rsyslog-mmnormalize. This gives you mmnormalize, a module that will do the parsing of common Apache logs to JSON
- rsyslog-elasticsearch, for the Elasticsearch output
With the ingredients in place, let’s start cooking a configuration. The configuration needs to do the following:
- load the required modules
- configure inputs: tailing Apache logs and system logs
- configure the main queue to buffer your messages. This is also the place to define the number of worker threads and batch sizes (which will also be Elasticsearch bulk sizes)
- parse common Apache logs into JSON
- define a template where you’d specify how JSON messages would look like. You’d use this template to send logs to Logsene/Elasticsearch via the Elasticsearch output
Loading modules
Here, we’ll need imfile to tail files, mmnormalize to parse them, and omelasticsearch to send them. If you want to tail the system logs, you’d also need to include imuxsock and imklog (for kernel logs).
# system logs
module(load="imuxsock")
module(load="imklog")
# file
module(load="imfile")
# parser
module(load="mmnormalize")
# sender
module(load="omelasticsearch")
Configure inputs
For system logs, you typically don’t need any special configuration (unless you want to listen to a non-default Unix Socket). For Apache logs, you’d point to the file(s) you want to monitor. You can use wildcards for file names as well. You also need to specify a syslog tag for each input. You can use this tag later for filtering.
input(type="imfile"
      File="/var/log/apache*.log"
      Tag="apache:"
)NOTE: By default, rsyslog will not poll for file changes every N seconds. Instead, it will rely on the kernel (via inotify) to poke it when files get changed. This makes the process quite realtime and scales well, especially if you have many files changing rarely. Inotify is also less prone to bugs when it comes to file rotation and other events that would otherwise happen between two “polls”. You can still use the legacy mode=”polling” by specifying it in imfile’s module parameters.
Queue and workers
By default, all incoming messages go into a main queue. You can also separate flows (e.g. files and system logs) by using different rulesets but let’s keep it simple for now.
For tailing files, this kind of queue would work well:
main_queue(
  queue.workerThreads="4"
  queue.dequeueBatchSize="1000"
  queue.size="10000"
)
This would be a small in-memory queue of 10K messages, which works well if Elasticsearch goes down, because the data is still in the file and rsyslog can stop tailing when the queue becomes full, and then resume tailing. 4 worker threads will pick batches of up to 1000 messages from the queue, parse them (see below) and send the resulting JSONs to Elasticsearch.
If you need a larger queue (e.g. if you have lots of system logs and want to make sure they’re not lost), I would recommend using a disk-assisted memory queue, that will spill to disk whenever it uses too much memory:
main_queue(
  queue.workerThreads="4"
  queue.dequeueBatchSize="1000"
  queue.highWatermark="500000"    # max no. of events to hold in memory
  queue.lowWatermark="200000"     # use memory queue again, when it's back to this level
  queue.spoolDirectory="/var/run/rsyslog/queues"  # where to write on disk
  queue.fileName="stats_ruleset"
  queue.maxDiskSpace="5g"        # it will stop at this much disk space
  queue.size="5000000"           # or this many messages
  queue.saveOnShutdown="on"      # save memory queue contents to disk when rsyslog is exiting
)
Parsing with mmnormalize
The message normalization module uses liblognorm to do the parsing. So in the configuration you’d simply point rsyslog to the liblognorm rulebase:
action(type="mmnormalize"
  rulebase="/opt/rsyslog/apache.rb"
)
where apache.rb will contain rules for parsing apache logs, that can look like this:
version=2

rule=:%clientip:word% %ident:word% %auth:word% [%timestamp:char-to:]%] "%verb:word% %request:word% HTTP/%httpversion:float%" %response:number% %bytes:number% "%referrer:char-to:"%" "%agent:char-to:"%"%blob:rest%
Where version=2 indicates that rsyslog should use liblognorm’s v2 engine (which is was introduced in rsyslog 8.13) and then you have the actual rule for parsing logs. You can find more details about configuring those rules in the liblognorm documentation.
Besides parsing Apache logs, creating new rules typically requires a lot of trial and error. To check your rules without messing with rsyslog, you can use the lognormalizer binary like:
head -1 /path/to/log.file | /usr/lib/lognorm/lognormalizer -r /path/to/rulebase.rb -e json
NOTE: If you’re used to Logstash’s grok, this kind of parsing rules will look very familiar. However, things are quite different under the hood. Grok is a nice abstraction over regular expressions, while liblognorm builds parse trees out of specialized parsers. This makes liblognorm much faster, especially as you add more rules. In fact, it scales so well, that for all practical purposes, performance depends on the length of the log lines and not on the number of rules. This post explains the theory behind this assuption, and this is actually proven by various tests. The downside is that you’ll lose some of the flexibility offered by regular expressions. You can still use regular expressions with liblognorm (you’d need to set allow_regex to on when loading mmnormalize) but then you’d lose a lot of the benefits that come with the parse tree approach.
Template for parsed logs
Since we want to push logs to Elasticsearch as JSON, we’d need to use templates to format them. For Apache logs, by the time parsing ended, you already have all the relevant fields in the $!all-json variable, that you’ll use as a template:
template(name="all-json" type="list"){
  property(name="$!all-json")
}
Template for time-based indices
For the logging use-case, you’d probably want to use time-based indices (e.g. if you keep your logs for 7 days, you can have one index per day). Such a design will give your cluster a lot more capacity due to the way Elasticsearch merges data in the background (you can learn the details in our presentations at GeeCON and Berlin Buzzwords).
To make rsyslog use daily or other time-based indices, you need to define a template that builds an index name off the timestamp of each log. This is one that names them logstash-YYYY.MM.DD, like Logstash does by default:
template(name="logstash-index"
  type="list") {
    constant(value="logstash-")
    property(name="timereported" dateFormat="rfc3339" position.from="1" position.to="4")
    constant(value=".")
    property(name="timereported" dateFormat="rfc3339" position.from="6" position.to="7")
    constant(value=".")
    property(name="timereported" dateFormat="rfc3339" position.from="9" position.to="10")
}
And then you’d use this template in the Elasticsearch output:
action(type="omelasticsearch"
  template="all-json"
  dynSearchIndex="on"
  searchIndex="logstash-index"
  searchType="apache"
  server="MY-ELASTICSEARCH-SERVER"
  bulkmode="on"
  action.resumeretrycount="-1"
)
Putting both Apache and system logs together
If you use the same rsyslog to parse system logs, mmnormalize won’t parse them (because they don’t match Apache’s common log format). In this case, you’ll need to pick the rsyslog properties you want and build an additional JSON template:
template(name="plain-syslog"
  type="list") {
    constant(value="{")
      constant(value="\"timestamp\":\"")     property(name="timereported" dateFormat="rfc3339")
      constant(value="\",\"host\":\"")        property(name="hostname")
      constant(value="\",\"severity\":\"")    property(name="syslogseverity-text")
      constant(value="\",\"facility\":\"")    property(name="syslogfacility-text")
      constant(value="\",\"tag\":\"")   property(name="syslogtag" format="json")
      constant(value="\",\"message\":\"")    property(name="msg" format="json")
    constant(value="\"}")
}
Then you can make rsyslog decide: if a log was parsed successfully, use the all-json template. If not, use the plain-syslog one:
if $parsesuccess == "OK" then {
 action(type="omelasticsearch"
  template="all-json"
  ...
 )
} else {
 action(type="omelasticsearch"
  template="plain-syslog"
  ...
 )
}
And that’s it! Now you can restart rsyslog and get both your system and Apache logs parsed, buffered and indexed into Elasticsearch. If you’re a Logsene user, the recipe is a bit simpler: you’d follow the same steps, except that you’ll skip the logstash-index template (Logsene does that for you) and your Elasticsearch actions will look like this:
action(type="omelasticsearch"
  template="all-json or plain-syslog"
  searchIndex="LOGSENE-APP-TOKEN-GOES-HERE"
  searchType="apache"
  server="logsene-receiver.sematext.com"
  serverport="80"
  bulkmode="on"
  action.resumeretrycount="-1"
)
Coupling with Logstash via Redis
Original post: Recipe: rsyslog + Redis + Logstash by @Sematext
OK, so you want to hook up rsyslog with Logstash. If you don’t remember why you want that, let me give you a few hints:
- Logstash can do lots of things, it’s easy to set up but tends to be too heavy to put on every server
- you have Redis already installed so you can use it as a centralized queue. If you don’t have it yet, it’s worth a try because it’s very light for this kind of workload.
- you have rsyslog on pretty much all your Linux boxes. It’s light and surprisingly capable, so why not make it push to Redis in order to hook it up with Logstash?
In this post, you’ll see how to install and configure the needed components so you can send your local syslog (or tail files with rsyslog) to be buffered in Redis so you can use Logstash to ship them to Elasticsearch, a logging SaaS like Logsene (which exposes the Elasticsearch API for both indexing and searching) so you can search and analyze them with Kibana:

RSyslog Windows Agent 3.1 Released
Adiscon is proud to announce the 3.1 release of RSyslog Windows Agent.
This is a maintenenance release for RSyslog Windows Agent. It includes some bugfixes as well as a new rule date condition which can be used to process events starting from a certain date. A few new options have been added into the Syslog Service as well.
Detailed information can be found in the version history below.
Build-IDs: Service 3.1.0.134, Client 3.1.0.213
Features |
|
Bugfixes |
|
Version 3.1 is a free download. Customers with existing 2.x keys can contact our Sales department for upgrade prices. If you have a valid Upgrade Insurance ID, you can request a free new key by sending your Upgrade Insurance ID to sales@adiscon.com. Please note that the download enables the free 30-day trial version if used without a key – so you can right now go ahead and evaluate it.