rsyslog gains native Azure Monitor Logs Ingestion support
Cloud logging environments are rarely simple. Many organizations run mixed estates where on-prem systems, private infrastructure, and cloud services all need to feed into a central observability workflow. That is exactly where rsyslog is supposed to help: reliable, flexible log transport and processing without forcing a one-size-fits-all architecture.

We have now taken another step in that direction.
With the merge of PR #6615 on March 18, 2026, rsyslog now includes a new output module, omazuredce, for sending events directly to Azure Monitor Logs Ingestion. The merged change includes the module itself, documentation, configuration parameters, build integration, and tests.
rsyslog 8.2510.0 (2025.10) released
We have today released the 8.25100 rsyslog scheduled stable release. This release delivers three main themes: better Windows Security event ingestion, more flexible JSON handling end to end, and pragmatic compatibility fixes across popular outputs and platforms. It also includes steady documentation improvements and CI hardening.
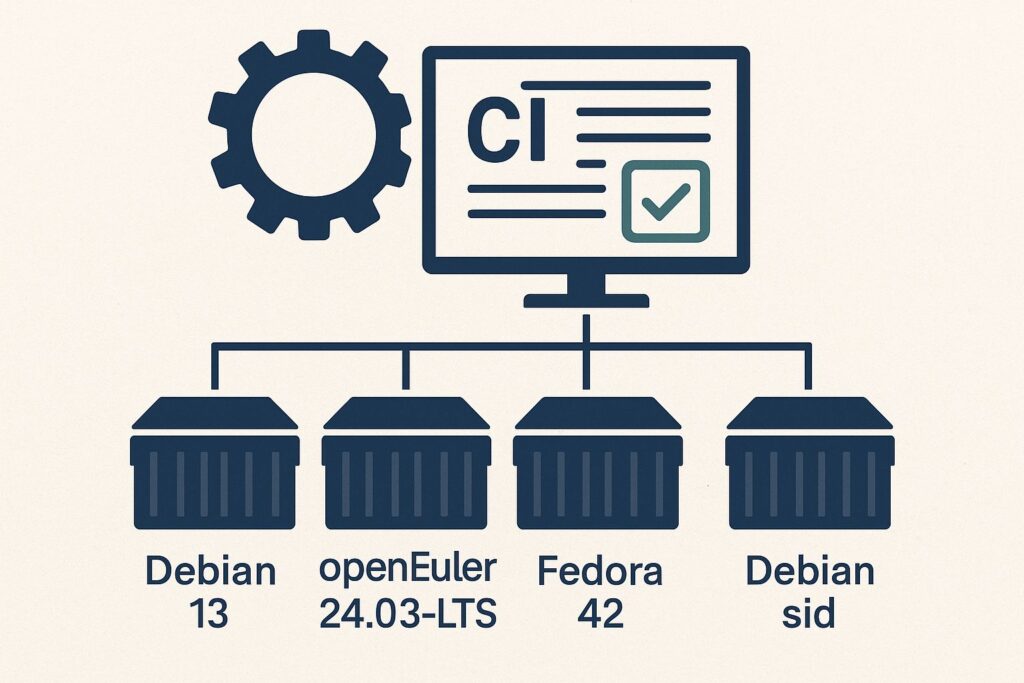
Continue reading “rsyslog 8.2510.0 (2025.10) released”CI extended: Debian 13, openEuler 24.03-LTS, Fedora 42, Debian sid
TL;DR: We added Debian 13, openEuler 24.03-LTS, Fedora 42, and Debian sid to rsyslog CI. We retired Ubuntu 18.04. CI runs use GitHub-hosted runners plus self-hosted workers, with infrastructure sponsored by GitHub, DigitalOcean, opencsv, and Adiscon.
rsyslog 8.34.0 (v8-stable) released
Today, we release rsyslog 8.34.0. Most notably is the large refactoring of the imfile module as well as the new module mmkubernetes (contributed). Additionaly, a lot of improvements and fixes have been added to the current release, too many to list them all. So please take a look at the changelog for all the details.
https://github.com/rsyslog/rsyslog/blob/v8-stable/ChangeLog
Download:
http://www.rsyslog.com/downloads/download-v8-stable/
As always, feedback is appreciated.
Best regards,
Florian Riedl
Connecting with Logstash via Apache Kafka
Original post: Recipe: rsyslog + Kafka + Logstash by @Sematext
This recipe is similar to the previous rsyslog + Redis + Logstash one, except that we’ll use Kafka as a central buffer and connecting point instead of Redis. You’ll have more of the same advantages:
- rsyslog is light and crazy-fast, including when you want it to tail files and parse unstructured data (see the Apache logs + rsyslog + Elasticsearch recipe)
- Kafka is awesome at buffering things
- Logstash can transform your logs and connect them to N destinations with unmatched ease
There are a couple of differences to the Redis recipe, though:
- rsyslog already has Kafka output packages, so it’s easier to set up
- Kafka has a different set of features than Redis (trying to avoid flame wars here) when it comes to queues and scaling
As with the other recipes, I’ll show you how to install and configure the needed components. The end result would be that local syslog (and tailed files, if you want to tail them) will end up in Elasticsearch, or a logging SaaS like Logsene (which exposes the Elasticsearch API for both indexing and searching). Of course you can choose to change your rsyslog configuration to parse logs as well (as we’ve shown before), and change Logstash to do other things (like adding GeoIP info).
Getting the ingredients
First of all, you’ll probably need to update rsyslog. Most distros come with ancient versions and don’t have the plugins you need. From the official packages you can install:
- rsyslog. This will update the base package, including the file-tailing module
- rsyslog-kafka. This will get you the Kafka output module
If you don’t have Kafka already, you can set it up by downloading the binary tar. And then you can follow the quickstart guide. Basically you’ll have to start Zookeeper first (assuming you don’t have one already that you’d want to re-use):
bin/zookeeper-server-start.sh config/zookeeper.properties
And then start Kafka itself and create a simple 1-partition topic that we’ll use for pushing logs from rsyslog to Logstash. Let’s call it rsyslog_logstash:
bin/kafka-server-start.sh config/server.properties
bin/kafka-topics.sh --create --zookeeper localhost:2181 --replication-factor 1 --partitions 1 --topic rsyslog_logstash
Finally, you’ll have Logstash. At the time of writing this, we have a beta of 2.0, which comes with lots of improvements (including huge performance gains of the GeoIP filter I touched on earlier). After downloading and unpacking, you can start it via:
bin/logstash -f logstash.conf
Though you also have packages, in which case you’d put the configuration file in /etc/logstash/conf.d/ and start it with the init script.
Configuring rsyslog
With rsyslog, you’d need to load the needed modules first:
module(load="imuxsock")  # will listen to your local syslog
module(load="imfile")    # if you want to tail files
module(load="omkafka")   # lets you send to Kafka
If you want to tail files, you’d have to add definitions for each group of files like this:
input(type="imfile"
  File="/opt/logs/example*.log"
  Tag="examplelogs"
)
Then you’d need a template that will build JSON documents out of your logs. You would publish these JSON’s to Kafka and consume them with Logstash. Here’s one that works well for plain syslog and tailed files that aren’t parsed via mmnormalize:
template(name="json_lines" type="list" option.json="on") {
  constant(value="{")
  constant(value="\"timestamp\":\"")
  property(name="timereported" dateFormat="rfc3339")
  constant(value="\",\"message\":\"")
  property(name="msg")
  constant(value="\",\"host\":\"")
  property(name="hostname")
  constant(value="\",\"severity\":\"")
  property(name="syslogseverity-text")
  constant(value="\",\"facility\":\"")
  property(name="syslogfacility-text")
  constant(value="\",\"syslog-tag\":\"")
  property(name="syslogtag")
  constant(value="\"}")
}
By default, rsyslog has a memory queue of 10K messages and has a single thread that works with batches of up to 16 messages (you can find all queue parameters here). You may want to change:
– the batch size, which also controls the maximum number of messages to be sent to Kafka at once
– the number of threads, which would parallelize sending to Kafka as well
– the size of the queue and its nature: in-memory(default), disk or disk-assisted
In a rsyslog->Kafka->Logstash setup I assume you want to keep rsyslog light, so these numbers would be small, like:
main_queue(
  queue.workerthreads="1"      # threads to work on the queue
  queue.dequeueBatchSize="100" # max number of messages to process at once
  queue.size="10000"           # max queue size
)
Finally, to publish to Kafka you’d mainly specify the brokers to connect to (in this example we have one listening to localhost:9092) and the name of the topic we just created:
action(
  broker=["localhost:9092"]
  type="omkafka"
  topic="rsyslog_logstash"
  template="json"
)
Assuming Kafka is started, rsyslog will keep pushing to it.
Configuring Logstash
This is the part where we pick the JSON logs (as defined in the earlier template) and forward them to the preferred destinations. First, we have the input, which will use to the Kafka topic we created. To connect, we’ll point Logstash to Zookeeper, and it will fetch all the info about Kafka from there:
input {
  kafka {
    zk_connect => "localhost:2181"
    topic_id => "rsyslog_logstash"
  }
}
At this point, you may want to use various filters to change your logs before pushing to Logsene/Elasticsearch. For this last step, you’d use the Elasticsearch output:
output {
  elasticsearch {
    hosts => "localhost" # it used to be "host" pre-2.0
    port => 9200
    #ssl => "true"
    #protocol => "http" # removed in 2.0
  }
}
And that’s it! Now you can use Kibana (or, in the case of Logsene, either Kibana or Logsene’s own UI) to search your logs!
rsyslog 8.3.5 (v8-devel) released
We have just released 8.3.5 of the v8-devel branch.
This is basically a maintenance release. It adds improved error output to omprog and a couple of patches were imported from the latest v7-stable (7.6.4).
ChangeLog:
http://www.rsyslog.com/changelog-for-8-3-5-v8-devel/
Download:
http://www.rsyslog.com/download-v8-devel/
As always, feedback is appreciated.
Best regards,
Florian Riedl
Changelog for 8.3.5 (v8-devel)
Version 8.3.5 [v8-devel] 2014-08-05omprog:
- emit error message via syslog() if loading binary fails
This happens after forking, so omprog has no longer access to rsyslog’s regular error reporting functions. Previously, this meant any error message was lost. Now it is emitted via regular syslog (which may end up in a different instance, if multiple instances run…) - couple of patches imported from v7-stable (7.6.4)
Performance Tuning&Tests for the Elasticsearch Output
Original post: Rsyslog 8.1 Elasticsearch Output Performance by @Sematext
Version 8 brings major changes in rsyslog’s core – see Rainer’s presentation about it for more details. Those changes should give outputs better performance, and the Elasticsearch one should benefit a lot. Since we’re using rsyslog and Elasticsearch in Sematext‘s own log analytics product, Logsene, we had to take the new version for a spin.
The Weapon and the Target
For testing, we used a good-old i3 laptop, with 8GB of RAM. We generated 20 million logs, sent them to rsyslog via TCP and from there to Elasticsearch in the Logstash format, so they can get explored with Kibana. The objective was to stuff as many events per second into Elasticsearch as possible.
Rsyslog Architecture Overview
In order to tweak rsyslog effectively, one needs to understand its architecture, which is not that obvious (although there’s an ongoing effort to improve the documentation). The gist of it its architecture represented in the figure below.
- you have input modules taking messages (from files, TCP/UDP, journal, etc.) and pushing them to a main queue
- one or more main queue threads take those events and parse them. By default, they parse syslog formats (RFC-3164, RFC-5424 and various derivatives), but you can configure rsyslog to use message modifier modules to do additional parsing (e.g. CEE-formatted JSON messages). Either way, this parsing generates structured events, made out of properties
- after parsing, the main queue threads push events to the action queue. Or queues, if there are multiple actions and you want to fan-out
- for each defined action, one or more action queue threads takes properties from events according to templates, and makes messages that would be sent to the destination. In Elasticsearch’s case, a template should make Elasticsearch JSON documents, and the destination would be the REST API endpoint

There are two more things to say about rsyslog’s architecture before we move on to the actual test:
- you can have multiple independent flows (like the one in the figure above) in the same rsyslog process by using rulesets. Think of rulesets as swim-lanes. They’re useful for example when you want to process local logs and remote logs in a completely separate manner
- queues can be in-memory, on disk, or a combination called disk-assisted. Here, we’ll use in-memory because they’re the fastest. For more information about how queues work, take a look here
Configuration
To generate messages, we used tcpflood, a small and light tool that’s part of rsyslog’s testbench. It generates messages and sends them over to the local syslog via TCP.
Rsyslog took received those messages with the imtcp input module, queued them and forwarded them to Elasticsearch 0.90.7, which was also installed locally. We also tried with Elasticsearch 1.0 and got the same results (see below).
The flow of messages in this test is represented in the following figure:

The actual rsyslog config is listed below (in the new configuration format). It can be tuned further (for example by using the multithreaded imptcp input module), but we didn’t get significant improvements in this particular scenario.
module(load="imtcp")   # TCP input module
module(load="omelasticsearch") # Elasticsearch output module

input(type="imtcp" port="13514")  # where to listen for TCP messages

main_queue(
  queue.size="1000000"   # capacity of the main queue
  queue.dequeuebatchsize="1000"  # process messages in batches of 1000 and move them to the action queues
  queue.workerthreads="2"  # 2 threads for the main queue
)

# template to generate JSON documents for Elasticsearch in Logstash format
template(name="plain-syslog"
         type="list") {
           constant(value="{")
             constant(value="\"@timestamp\":\"")      property(name="timereported" dateFormat="rfc3339")
             constant(value="\",\"host\":\"")        property(name="hostname")
             constant(value="\",\"severity\":\"")    property(name="syslogseverity-text")
             constant(value="\",\"facility\":\"")    property(name="syslogfacility-text")
             constant(value="\",\"syslogtag\":\"")   property(name="syslogtag" format="json")
             constant(value="\",\"message\":\"")    property(name="msg" format="json")
             constant(value="\"}")
         }

action(type="omelasticsearch"
       template="plain-syslog"  # use the template defined earlier
       searchIndex="test-index"
       bulkmode="on"                   # use the Bulk API
       queue.dequeuebatchsize="5000"   # ES bulk size
       queue.size="100000"   # capacity of the action queue
       queue.workerthreads="5"   # 5 workers for the action
       action.resumeretrycount="-1"  # retry indefinitely if ES is unreachable
)
You can see from the configuration that:
- both main and action queues have a defined size in number of messages
- both have number of threads that deliver messages to the next step. The action needs more because it has to wait for Elasticsearch to reply
- moving of messages from the queues happens in batches. For the Elasticsearch output, the batch of messages is sent through the Bulk API, which makes queue.dequeuebatchsize effectively the bulk size
Results
We started with default Elasticsearch settings. Then we tuned them to leave rsyslog with a more significant slice of the CPU. We monitored the indexing rate with SPM for Elasticsearch. Here are the average results over 20 million indexed events:
- with default Elasticsearch settings, we got 8,000 events per second
- after setting Elasticsearch up more production-like (5 second refresh interval, increased index buffer size, translog thresholds, etc), and the throughput went up to average of 20,000 events per second
- in the end, we went berserk and used in-memory indices, updated the mapping to disable any storing or indexing for any field, to have Elasticsearch do as little work as possible and make room for rsyslog. Got an average of 30,000 events per second. In this scenario, rsyslog was using between 1 and 1.5 of the 4 virtual CPU cores, with tcpflood using 0.5 and Elasticsearch using from 2 to 2.5
Conclusion
20K EPS on a low-end machine with production-like configuration means Elasticsearch is quick at indexing. This is very good for logs, where you typically have lots of messages being generated, compared to how often you search.
If you need some tool to ship your logs to Elasticsearch with minimum overhead, rsyslog version 8 may well be your best bet.
Related posts:
imagemap-test
action.execOnlyWhenPreviousIsSuspended preciseness
The “action.execOnlyWhenPreviousIsSuspended” parameter permits to conditionally execute an action only if the previous one is suspended. When an action actually gets suspended depends on the output module implementing the action, but the general rule is that an action suspends itself if there is a problem doing it’s job (e.g. a target server is down). This setting is generally used to implement failover destinations. So let’s call actions which have this attribute set “failover actions”.
Note that many action implement transactions to improve performance. If so, usually the success or error state of the action is only available after the transaction has been comitted. At this point, the messages have already been submitted to the action and the action could not set suspension state — simply because at that point everything looked fine. So when the failover action was about to be executed, the suspended flag was not set and the action not executed. Depending on system configuration, this can lead to loss of some messages during the failover process. If this seems totally unacceptable to you, you need to make sure that the transaction is committed after each message — this permits the output to obtain the actual success state (note that with some technologies, even this is not totally possible – a prime example is plain TCP syslog protocol).
To ensure commit of each message, the queue’s maximum batch size needs to be reduced to one. This can be done via the “queue.dequeuebatchsize” parameter. Note that reducing the batch size can have severe performance impact. Unfortunately, it is impossible to to have both high performance and precise failover actions. The simple reason is that for precise failover actions we need to know the result of the commit operation, which makes it necessary to do immediate commits.