Using rsyslog to Reindex/Migrate Elasticsearch data
Original post: Scalable and Flexible Elasticsearch Reindexing via rsyslog by @Sematext
This recipe is useful in a two scenarios:
- migrating data from one Elasticsearch cluster to another (e.g. when you’re upgrading from Elasticsearch 1.x to 2.x or later)
- reindexing data from one index to another in a cluster pre 2.3. For clusters on version 2.3 or later, you can use the Reindex API
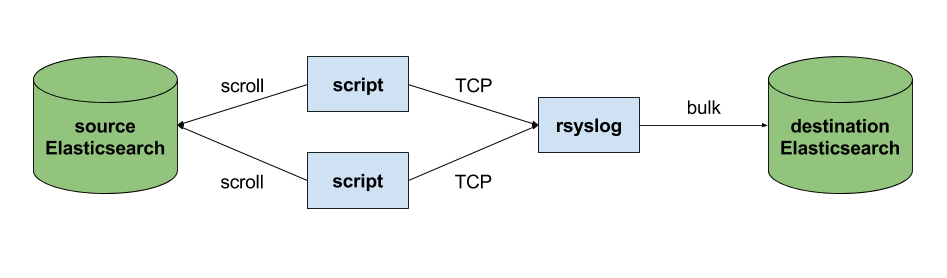
Back to the recipe, we used an external application to scroll through Elasticsearch documents in the source cluster and push them to rsyslog via TCP. Then we used rsyslog’s Elasticsearch output to push logs to the destination cluster. The overall flow would be:

This is an easy way to extend rsyslog, using whichever language you’re comfortable with, to support more inputs. Here, we piggyback on the TCP input. You can do a similar job with filters/parsers – you can find GeoIP implementations, for example – by piggybacking the mmexternal module, which uses stdout&stdin for communication. The same is possible for outputs, normally added via the omprog module: we did this to add a Solr output and one for SPM custom metrics.
The custom script in question doesn’t have to be multi-threaded, you can simply spin up more of them, scrolling different indices. In this particular case, using two scripts gave us slightly better throughput, saturating the network:
Writing the custom script
Before starting to write the script, one needs to know how the messages sent to rsyslog would look like. To be able to index data, rsyslog will need an index name, a type name and optionally an ID. In this particular case, we were dealing with logs, so the ID wasn’t necessary.
With this in mind, I see a number of ways of sending data to rsyslog:
- one big JSON per line. One can use mmnormalize to parse that JSON, which then allows rsyslog do use values from within it as index name, type name, and so on
- for each line, begin with the bits of “extra data” (like index and type names) then put the JSON document that you want to reindex. Again, you can use mmnormalize to parse, but this time you can simply trust that the last thing is a JSON and send it to Elasticsearch directly, without the need to parse it
- if you only need to pass two variables (index and type name, in this case), you can piggyback on the vague spec of RFC3164 syslog and send something like
destination_index document_type:{"original": "document"}
This last option will parse the provided index name in the hostname variable, the type in syslogtag and the original document in msg. A bit hacky, I know, but quite convenient (makes the rsyslog configuration straightforward) and very fast, since we know the RFC3164 parser is very quick and it runs on all messages anyway. No need for mmnormalize, unless you want to change the document in-flight with rsyslog.
Below you can find the Python code that can scan through existing documents in an index (or index pattern, like logstash_2016.05.*) and push them to rsyslog via TCP. You’ll need the Python Elasticsearch client (pip install elasticsearch) and you’d run it like this:
python elasticsearch_to_rsyslog.py source_index destination_index
The script being:
from elasticsearch import Elasticsearch
import json, socket, sys

source_cluster = ['server1', 'server2']
rsyslog_address = '127.0.0.1'
rsyslog_port = 5514

es = Elasticsearch(source_cluster,
      retry_on_timeout=True,
      max_retries=10)
s = socket.socket(socket.AF_INET, socket.SOCK_STREAM)
s.connect((rsyslog_address, rsyslog_port))


result = es.search(index=sys.argv[1], scroll='1m', search_type='scan', size=500)

while True:
  res = es.scroll(scroll_id=result['_scroll_id'], scroll='1m')
  for hit in result['hits']['hits']:
    s.send(sys.argv[2] + ' ' + hit["_type"] + ':' + json.dumps(hit["_source"])+'\n')
  if not result['hits']['hits']:
    break

s.close()
If you need to modify messages, you can parse them in rsyslog via mmjsonparse and then add/remove fields though rsyslog’s scripting language. Though I couldn’t find a nice way to change field names – for example to remove the dots that are forbidden since Elasticsearch 2.0 – so I did that in the Python script:
def de_dot(my_dict):
  for key, value in my_dict.iteritems():
    if '.' in key:
      my_dict[key.replace('.','_')] = my_dict.pop(key)
    if type(value) is dict:
      my_dict[key] = de_dot(my_dict.pop(key))
  return my_dict
And then the “send” line becomes:
s.send(sys.argv[2] + ' ' + hit["_type"] + ':' + json.dumps(de_dot(hit["_source"]))+'\n')
Configuring rsyslog
The first step here is to make sure you have the lastest rsyslog, though the config below works with versions all the way back to 7.x (which can be found in most Linux distributions). You just need to make sure the rsyslog-elasticsearch package is installed, because we need the Elasticsearch output module.
# messages bigger than this are truncated
$maxMessageSize 10000000  # ~10MB

# load the TCP input and the ES output modules
module(load="imtcp")
module(load="omelasticsearch")

main_queue(
  # buffer up to 1M messages in memory
  queue.size="1000000"
  # these threads process messages and send them to Elasticsearch
  queue.workerThreads="4"
  # rsyslog processes messages in batches to avoid queue contention
  # this will also be the Elasticsearch bulk size
  queue.dequeueBatchSize="4000"
)

# we use templates to specify how the data sent to Elasticsearch looks like
template(name="document" type="list"){
  # the "msg" variable contains the document
  property(name="msg")
}
template(name="index" type="list"){
  # "hostname" has the index name
  property(name="hostname")
}
template(name="type" type="list"){
  # "syslogtag" has the type name
  property(name="syslogtag")
}

# start the TCP listener on the port we pointed the Python script to
input(type="imtcp" port="5514")

# sending data to Elasticsearch, using the templates defined earlier
action(type="omelasticsearch"
  template="document"
  dynSearchIndex="on" searchIndex="index"
  dynSearchType="on" searchType="type"
  server="localhost"  # destination Elasticsearch host
  serverport="9200"   # and port
  bulkmode="on"  # use the bulk API
  action.resumeretrycount="-1"  # retry indefinitely if Elasticsearch is unreachable
)
This configuration doesn’t have to disturb your local syslog (i.e. by replacing /etc/rsyslog.conf). You can put it someplace else and run a different rsyslog process:
rsyslogd -i /var/run/rsyslog_reindexer.pid -f /home/me/rsyslog_reindexer.conf
And that’s it! With rsyslog started, you can start the Python script(s) and do the reindexing.
Monitoring rsyslog’s impstats with Kibana and SPM
Original post: Monitoring rsyslog with Kibana and SPM by @Sematext
A while ago we published this post where we explained how you can get stats about rsyslog, such as the number of messages enqueued, the number of output errors and so on. The point was to send them to Elasticsearch (or Logsene, our logging SaaS, which exposes the Elasticsearch API) in order to analyze them.
This is part 2 of that story, where we share how we process these stats in production. We’ll cover:
- an updated config, working with Elasticsearch 2.x
- what Kibana dashboards we have in Logsene to get an overview of what rsyslog is doing
- how we send some of these metrics to SPM as well, in order to set up alerts on their values: both threshold-based alerts and anomaly detection
Continue reading “Monitoring rsyslog’s impstats with Kibana and SPM”
Connecting with Logstash via Apache Kafka
Original post: Recipe: rsyslog + Kafka + Logstash by @Sematext
This recipe is similar to the previous rsyslog + Redis + Logstash one, except that we’ll use Kafka as a central buffer and connecting point instead of Redis. You’ll have more of the same advantages:
- rsyslog is light and crazy-fast, including when you want it to tail files and parse unstructured data (see the Apache logs + rsyslog + Elasticsearch recipe)
- Kafka is awesome at buffering things
- Logstash can transform your logs and connect them to N destinations with unmatched ease
There are a couple of differences to the Redis recipe, though:
- rsyslog already has Kafka output packages, so it’s easier to set up
- Kafka has a different set of features than Redis (trying to avoid flame wars here) when it comes to queues and scaling
As with the other recipes, I’ll show you how to install and configure the needed components. The end result would be that local syslog (and tailed files, if you want to tail them) will end up in Elasticsearch, or a logging SaaS like Logsene (which exposes the Elasticsearch API for both indexing and searching). Of course you can choose to change your rsyslog configuration to parse logs as well (as we’ve shown before), and change Logstash to do other things (like adding GeoIP info).
Getting the ingredients
First of all, you’ll probably need to update rsyslog. Most distros come with ancient versions and don’t have the plugins you need. From the official packages you can install:
- rsyslog. This will update the base package, including the file-tailing module
- rsyslog-kafka. This will get you the Kafka output module
If you don’t have Kafka already, you can set it up by downloading the binary tar. And then you can follow the quickstart guide. Basically you’ll have to start Zookeeper first (assuming you don’t have one already that you’d want to re-use):
bin/zookeeper-server-start.sh config/zookeeper.properties
And then start Kafka itself and create a simple 1-partition topic that we’ll use for pushing logs from rsyslog to Logstash. Let’s call it rsyslog_logstash:
bin/kafka-server-start.sh config/server.properties
bin/kafka-topics.sh --create --zookeeper localhost:2181 --replication-factor 1 --partitions 1 --topic rsyslog_logstash
Finally, you’ll have Logstash. At the time of writing this, we have a beta of 2.0, which comes with lots of improvements (including huge performance gains of the GeoIP filter I touched on earlier). After downloading and unpacking, you can start it via:
bin/logstash -f logstash.conf
Though you also have packages, in which case you’d put the configuration file in /etc/logstash/conf.d/ and start it with the init script.
Configuring rsyslog
With rsyslog, you’d need to load the needed modules first:
module(load="imuxsock")  # will listen to your local syslog
module(load="imfile")    # if you want to tail files
module(load="omkafka")   # lets you send to Kafka
If you want to tail files, you’d have to add definitions for each group of files like this:
input(type="imfile"
  File="/opt/logs/example*.log"
  Tag="examplelogs"
)
Then you’d need a template that will build JSON documents out of your logs. You would publish these JSON’s to Kafka and consume them with Logstash. Here’s one that works well for plain syslog and tailed files that aren’t parsed via mmnormalize:
template(name="json_lines" type="list" option.json="on") {
  constant(value="{")
  constant(value="\"timestamp\":\"")
  property(name="timereported" dateFormat="rfc3339")
  constant(value="\",\"message\":\"")
  property(name="msg")
  constant(value="\",\"host\":\"")
  property(name="hostname")
  constant(value="\",\"severity\":\"")
  property(name="syslogseverity-text")
  constant(value="\",\"facility\":\"")
  property(name="syslogfacility-text")
  constant(value="\",\"syslog-tag\":\"")
  property(name="syslogtag")
  constant(value="\"}")
}
By default, rsyslog has a memory queue of 10K messages and has a single thread that works with batches of up to 16 messages (you can find all queue parameters here). You may want to change:
– the batch size, which also controls the maximum number of messages to be sent to Kafka at once
– the number of threads, which would parallelize sending to Kafka as well
– the size of the queue and its nature: in-memory(default), disk or disk-assisted
In a rsyslog->Kafka->Logstash setup I assume you want to keep rsyslog light, so these numbers would be small, like:
main_queue(
  queue.workerthreads="1"      # threads to work on the queue
  queue.dequeueBatchSize="100" # max number of messages to process at once
  queue.size="10000"           # max queue size
)
Finally, to publish to Kafka you’d mainly specify the brokers to connect to (in this example we have one listening to localhost:9092) and the name of the topic we just created:
action(
  broker=["localhost:9092"]
  type="omkafka"
  topic="rsyslog_logstash"
  template="json"
)
Assuming Kafka is started, rsyslog will keep pushing to it.
Configuring Logstash
This is the part where we pick the JSON logs (as defined in the earlier template) and forward them to the preferred destinations. First, we have the input, which will use to the Kafka topic we created. To connect, we’ll point Logstash to Zookeeper, and it will fetch all the info about Kafka from there:
input {
  kafka {
    zk_connect => "localhost:2181"
    topic_id => "rsyslog_logstash"
  }
}
At this point, you may want to use various filters to change your logs before pushing to Logsene/Elasticsearch. For this last step, you’d use the Elasticsearch output:
output {
  elasticsearch {
    hosts => "localhost" # it used to be "host" pre-2.0
    port => 9200
    #ssl => "true"
    #protocol => "http" # removed in 2.0
  }
}
And that’s it! Now you can use Kibana (or, in the case of Logsene, either Kibana or Logsene’s own UI) to search your logs!
Recipe: Apache Logs + rsyslog (parsing) + Elasticsearch
Original post: Recipe: Apache Logs + rsyslog (parsing) + Elasticsearch by @Sematext
This recipe is about tailing Apache HTTPD logs with rsyslog, parsing them into structured JSON documents, and forwarding them to Elasticsearch (or a log analytics SaaS, like Logsene, which exposes the Elasticsearch API). Having them indexed in a structured way will allow you to do better analytics with tools like Kibana:

We’ll also cover pushing logs coming from the syslog socket and kernel, and how to buffer all of them properly. So this is quite a complete recipe for your centralized logging needs.
Getting the ingredients
Even though most distros already have rsyslog installed, it’s highly recommended to get the latest stable from the rsyslog repositories. The packages you’ll need are:
- rsyslog. The base package, including the file-tailing module (imfile)
- rsyslog-mmnormalize. This gives you mmnormalize, a module that will do the parsing of common Apache logs to JSON
- rsyslog-elasticsearch, for the Elasticsearch output
With the ingredients in place, let’s start cooking a configuration. The configuration needs to do the following:
- load the required modules
- configure inputs: tailing Apache logs and system logs
- configure the main queue to buffer your messages. This is also the place to define the number of worker threads and batch sizes (which will also be Elasticsearch bulk sizes)
- parse common Apache logs into JSON
- define a template where you’d specify how JSON messages would look like. You’d use this template to send logs to Logsene/Elasticsearch via the Elasticsearch output
Loading modules
Here, we’ll need imfile to tail files, mmnormalize to parse them, and omelasticsearch to send them. If you want to tail the system logs, you’d also need to include imuxsock and imklog (for kernel logs).
# system logs
module(load="imuxsock")
module(load="imklog")
# file
module(load="imfile")
# parser
module(load="mmnormalize")
# sender
module(load="omelasticsearch")
Configure inputs
For system logs, you typically don’t need any special configuration (unless you want to listen to a non-default Unix Socket). For Apache logs, you’d point to the file(s) you want to monitor. You can use wildcards for file names as well. You also need to specify a syslog tag for each input. You can use this tag later for filtering.
input(type="imfile"
      File="/var/log/apache*.log"
      Tag="apache:"
)NOTE: By default, rsyslog will not poll for file changes every N seconds. Instead, it will rely on the kernel (via inotify) to poke it when files get changed. This makes the process quite realtime and scales well, especially if you have many files changing rarely. Inotify is also less prone to bugs when it comes to file rotation and other events that would otherwise happen between two “polls”. You can still use the legacy mode=”polling” by specifying it in imfile’s module parameters.
Queue and workers
By default, all incoming messages go into a main queue. You can also separate flows (e.g. files and system logs) by using different rulesets but let’s keep it simple for now.
For tailing files, this kind of queue would work well:
main_queue(
  queue.workerThreads="4"
  queue.dequeueBatchSize="1000"
  queue.size="10000"
)
This would be a small in-memory queue of 10K messages, which works well if Elasticsearch goes down, because the data is still in the file and rsyslog can stop tailing when the queue becomes full, and then resume tailing. 4 worker threads will pick batches of up to 1000 messages from the queue, parse them (see below) and send the resulting JSONs to Elasticsearch.
If you need a larger queue (e.g. if you have lots of system logs and want to make sure they’re not lost), I would recommend using a disk-assisted memory queue, that will spill to disk whenever it uses too much memory:
main_queue(
  queue.workerThreads="4"
  queue.dequeueBatchSize="1000"
  queue.highWatermark="500000"    # max no. of events to hold in memory
  queue.lowWatermark="200000"     # use memory queue again, when it's back to this level
  queue.spoolDirectory="/var/run/rsyslog/queues"  # where to write on disk
  queue.fileName="stats_ruleset"
  queue.maxDiskSpace="5g"        # it will stop at this much disk space
  queue.size="5000000"           # or this many messages
  queue.saveOnShutdown="on"      # save memory queue contents to disk when rsyslog is exiting
)
Parsing with mmnormalize
The message normalization module uses liblognorm to do the parsing. So in the configuration you’d simply point rsyslog to the liblognorm rulebase:
action(type="mmnormalize"
  rulebase="/opt/rsyslog/apache.rb"
)
where apache.rb will contain rules for parsing apache logs, that can look like this:
version=2

rule=:%clientip:word% %ident:word% %auth:word% [%timestamp:char-to:]%] "%verb:word% %request:word% HTTP/%httpversion:float%" %response:number% %bytes:number% "%referrer:char-to:"%" "%agent:char-to:"%"%blob:rest%
Where version=2 indicates that rsyslog should use liblognorm’s v2 engine (which is was introduced in rsyslog 8.13) and then you have the actual rule for parsing logs. You can find more details about configuring those rules in the liblognorm documentation.
Besides parsing Apache logs, creating new rules typically requires a lot of trial and error. To check your rules without messing with rsyslog, you can use the lognormalizer binary like:
head -1 /path/to/log.file | /usr/lib/lognorm/lognormalizer -r /path/to/rulebase.rb -e json
NOTE: If you’re used to Logstash’s grok, this kind of parsing rules will look very familiar. However, things are quite different under the hood. Grok is a nice abstraction over regular expressions, while liblognorm builds parse trees out of specialized parsers. This makes liblognorm much faster, especially as you add more rules. In fact, it scales so well, that for all practical purposes, performance depends on the length of the log lines and not on the number of rules. This post explains the theory behind this assuption, and this is actually proven by various tests. The downside is that you’ll lose some of the flexibility offered by regular expressions. You can still use regular expressions with liblognorm (you’d need to set allow_regex to on when loading mmnormalize) but then you’d lose a lot of the benefits that come with the parse tree approach.
Template for parsed logs
Since we want to push logs to Elasticsearch as JSON, we’d need to use templates to format them. For Apache logs, by the time parsing ended, you already have all the relevant fields in the $!all-json variable, that you’ll use as a template:
template(name="all-json" type="list"){
  property(name="$!all-json")
}
Template for time-based indices
For the logging use-case, you’d probably want to use time-based indices (e.g. if you keep your logs for 7 days, you can have one index per day). Such a design will give your cluster a lot more capacity due to the way Elasticsearch merges data in the background (you can learn the details in our presentations at GeeCON and Berlin Buzzwords).
To make rsyslog use daily or other time-based indices, you need to define a template that builds an index name off the timestamp of each log. This is one that names them logstash-YYYY.MM.DD, like Logstash does by default:
template(name="logstash-index"
  type="list") {
    constant(value="logstash-")
    property(name="timereported" dateFormat="rfc3339" position.from="1" position.to="4")
    constant(value=".")
    property(name="timereported" dateFormat="rfc3339" position.from="6" position.to="7")
    constant(value=".")
    property(name="timereported" dateFormat="rfc3339" position.from="9" position.to="10")
}
And then you’d use this template in the Elasticsearch output:
action(type="omelasticsearch"
  template="all-json"
  dynSearchIndex="on"
  searchIndex="logstash-index"
  searchType="apache"
  server="MY-ELASTICSEARCH-SERVER"
  bulkmode="on"
  action.resumeretrycount="-1"
)
Putting both Apache and system logs together
If you use the same rsyslog to parse system logs, mmnormalize won’t parse them (because they don’t match Apache’s common log format). In this case, you’ll need to pick the rsyslog properties you want and build an additional JSON template:
template(name="plain-syslog"
  type="list") {
    constant(value="{")
      constant(value="\"timestamp\":\"")     property(name="timereported" dateFormat="rfc3339")
      constant(value="\",\"host\":\"")        property(name="hostname")
      constant(value="\",\"severity\":\"")    property(name="syslogseverity-text")
      constant(value="\",\"facility\":\"")    property(name="syslogfacility-text")
      constant(value="\",\"tag\":\"")   property(name="syslogtag" format="json")
      constant(value="\",\"message\":\"")    property(name="msg" format="json")
    constant(value="\"}")
}
Then you can make rsyslog decide: if a log was parsed successfully, use the all-json template. If not, use the plain-syslog one:
if $parsesuccess == "OK" then {
 action(type="omelasticsearch"
  template="all-json"
  ...
 )
} else {
 action(type="omelasticsearch"
  template="plain-syslog"
  ...
 )
}
And that’s it! Now you can restart rsyslog and get both your system and Apache logs parsed, buffered and indexed into Elasticsearch. If you’re a Logsene user, the recipe is a bit simpler: you’d follow the same steps, except that you’ll skip the logstash-index template (Logsene does that for you) and your Elasticsearch actions will look like this:
action(type="omelasticsearch"
  template="all-json or plain-syslog"
  searchIndex="LOGSENE-APP-TOKEN-GOES-HERE"
  searchType="apache"
  server="logsene-receiver.sematext.com"
  serverport="80"
  bulkmode="on"
  action.resumeretrycount="-1"
)
Coupling with Logstash via Redis
Original post: Recipe: rsyslog + Redis + Logstash by @Sematext
OK, so you want to hook up rsyslog with Logstash. If you don’t remember why you want that, let me give you a few hints:
- Logstash can do lots of things, it’s easy to set up but tends to be too heavy to put on every server
- you have Redis already installed so you can use it as a centralized queue. If you don’t have it yet, it’s worth a try because it’s very light for this kind of workload.
- you have rsyslog on pretty much all your Linux boxes. It’s light and surprisingly capable, so why not make it push to Redis in order to hook it up with Logstash?
In this post, you’ll see how to install and configure the needed components so you can send your local syslog (or tail files with rsyslog) to be buffered in Redis so you can use Logstash to ship them to Elasticsearch, a logging SaaS like Logsene (which exposes the Elasticsearch API for both indexing and searching) so you can search and analyze them with Kibana:

Tutorial: Sending impstats Metrics to Elasticsearch Using Rulesets and Queues
Originally posted on the Sematext blog: Monitoring rsyslog’s Performance with impstats and Elasticsearch
If you’re using rsyslog for processing lots of logs (and, as we’ve shown before, rsyslog is good at processing lots of logs), you’re probably interested in monitoring it. To do that, you can use impstats, which comes from input module for process stats. impstats produces information like:
– input stats, like how many events went through each input
– queue stats, like the maximum size of a queue
– action (output or message modification) stats, like how many events were forwarded by each action
– general stats, like CPU time or memory usage
In this post, we’ll show you how to send those stats to Elasticsearch (or Logsene — essentially hosted ELK, our log analytics service, that exposes the Elasticsearch API), where you can explore them with a nice UI, like Kibana. For example get the number of logs going through each input/output per hour:
More precisely, we’ll look at:
– useful options around impstats
– how to use those stats and what they’re about
– how to ship stats to Elasticsearch/Logsene by using rsyslog’s Elasticsearch output
– how to do this shipping in a fast and reliable way. This will apply to most rsyslog use-cases, not only impstats
Continue reading “Tutorial: Sending impstats Metrics to Elasticsearch Using Rulesets and Queues”
Using rsyslog and Elasticsearch to Handle Different Types of JSON Logs
Originally posted on the Sematext blog: Using Elasticsearch Mapping Types to Handle Different JSON Logs
By default, Elasticsearch does a good job of figuring the type of data in each field of your logs. But if you like your logs structured like we do, you probably want more control over how they’re indexed: is time_elapsed an integer or a float? Do you want your tags analyzed so you can search for big in big data? Or do you need it not_analyzed, so you can show top tags via the terms aggregation? Or maybe both?
In this post, we’ll look at how to use index templates to manage multiple types of logs across multiple indices. Also, we’ll explain how to use rsyslog to handle JSON logging and specify types.
Elasticsearch Mapping and Logs
To control settings for how a field is analyzed in Elasticsearch, you’ll need to define a mapping. This works similarly in Logsene, our log analytics SaaS, because it uses Elasticsearch and exposes its API.
With logs you’ll probably use time-based indices, because they scale better (in Logsene, for instance, you get daily indices). To make sure the mapping you define today applies to the index you create tomorrow, you need to define it in an index template.
Managing Multiple Types
Mappings provide a nice abstraction when you have to deal with multiple types of structured data. Let’s say you have two apps generating logs of different structures: both have a timestamp field, but one recording logins has a user field, and another one recording purchases has an amount field.
To deal with this, you can define the timestamp field in the _default_ mapping which applies to all types. Then, in each type’s own mapping we’ll define fields unique to that mapping. The following snippet is an example that works with Logsene, provided that aaaaaaaa-bbbb-cccc-dddd-eeeeeeeeeeee is your Logsene app token. If you roll your own Elasticsearch, you can use whichever name you want, and make sure the template name applies to matches index pattern (for example, logs-* will work if your indices are in the logs-YYYY-MM-dd format).
curl -XPUT 'logsene-receiver.sematext.com/_template/aaaaaaaa-bbbb-cccc-dddd-eeeeeeeeeeee_MyTemplate' -d '{
 "template" : "aaaaaaaa-bbbb-cccc-dddd-eeeeeeeeeeee*",
 "order" : 21,
 "mappings" : {
  "_default_" : {
   "properties" : {
    "timestamp" : { "type" : "date" }
   }
  },
  "firstapp" : {
   "properties" : {
    "user" : { "type" : "string" }
   }
  },
  "secondapp" : {
   "properties" : {
    "amount" : { "type" : "long" }
   }
  }
 }
}'
Sending JSON Logs to Specific Types
When you send a document to Elasticsearch by using the API, you have to provide an index and a type. You can use an Elasticsearch client for your preferred language to log directly to Elasticsearch or Logsene this way. But I wouldn’t recommend this, because then you’d have to manage things like buffering if the destination is unreachable.
Instead, I’d keep my logging simple and use a specialized logging tool, such as rsyslog, to do the hard work for me. Logging to a file is usually the easiest option. It’s local, and you can have your logging tool tail the file and send contents over the network. I usually prefer sockets (like syslog) because they let me configure rsyslog to:
– write events in a human format to a local file I can tail if I need to (usually in development)
– forward logs without hitting disk if I need to (usually in production)
Whatever you prefer, I think writing to local files or sockets is better than sending logs over the network from your application. Unless you’re willing to do a reliability trade-off and use UDP, which gets rid of most complexities.
Opinions aside, if you want to send JSON over syslog, there’s the JSON-over-syslog (CEE) format that we detailed in a previous post. You can use rsyslog’s JSON parser module to take your structured logs and forward them to Logsene:
module(load="imuxsock")        # can listen to local syslog socket
module(load="omelasticsearch") # can forward to Elasticsearch
module(load="mmjsonparse")     # can parse JSON

action(type="mmjsonparse")  # parse CEE-formatted messages

template(name="syslog-cee" type="list") {  # Elasticsearch documents will contain
  property(name="$!all-json")              # all JSON fields that were parsed
}

action(
  type="omelasticsearch"
  template="syslog-cee"                     # use the template defined earlier
  server="logsene-receiver.sematext.com"
  serverport="80"
  searchType="syslogapp"
  searchIndex="LOGSENE-APP-TOKEN-GOES-HERE"
  bulkmode="on"                                # send logs in batches
  queue.dequeuebatchsize="1000"                # of up to 1000
  action.resumeretrycount="-1"    # retry indefinitely (buffer) if destination is unreachable
)
To send a CEE-formatted syslog, you can run logger ‘@cee: {“amount”: 50}’ for example. Rsyslog would forward this JSON to Elasticsearch or Logsene via HTTP. Note that Logsene also supports CEE-formatted JSON over syslog out of the box if you want to use a syslog protocol instead of the Elasticsearch API.
Filtering by Type
Once your logs are in, you can filter them by type (via the _type field) in Kibana:

However, if you want more refined filtering by source, we suggest using a separate field for storing the application name. This can be useful when you have different applications using the same logging format. For example, both crond and postfix use plain syslog.
Performance Tuning&Tests for the Elasticsearch Output
Original post: Rsyslog 8.1 Elasticsearch Output Performance by @Sematext
Version 8 brings major changes in rsyslog’s core – see Rainer’s presentation about it for more details. Those changes should give outputs better performance, and the Elasticsearch one should benefit a lot. Since we’re using rsyslog and Elasticsearch in Sematext‘s own log analytics product, Logsene, we had to take the new version for a spin.
The Weapon and the Target
For testing, we used a good-old i3 laptop, with 8GB of RAM. We generated 20 million logs, sent them to rsyslog via TCP and from there to Elasticsearch in the Logstash format, so they can get explored with Kibana. The objective was to stuff as many events per second into Elasticsearch as possible.
Rsyslog Architecture Overview
In order to tweak rsyslog effectively, one needs to understand its architecture, which is not that obvious (although there’s an ongoing effort to improve the documentation). The gist of it its architecture represented in the figure below.
- you have input modules taking messages (from files, TCP/UDP, journal, etc.) and pushing them to a main queue
- one or more main queue threads take those events and parse them. By default, they parse syslog formats (RFC-3164, RFC-5424 and various derivatives), but you can configure rsyslog to use message modifier modules to do additional parsing (e.g. CEE-formatted JSON messages). Either way, this parsing generates structured events, made out of properties
- after parsing, the main queue threads push events to the action queue. Or queues, if there are multiple actions and you want to fan-out
- for each defined action, one or more action queue threads takes properties from events according to templates, and makes messages that would be sent to the destination. In Elasticsearch’s case, a template should make Elasticsearch JSON documents, and the destination would be the REST API endpoint

There are two more things to say about rsyslog’s architecture before we move on to the actual test:
- you can have multiple independent flows (like the one in the figure above) in the same rsyslog process by using rulesets. Think of rulesets as swim-lanes. They’re useful for example when you want to process local logs and remote logs in a completely separate manner
- queues can be in-memory, on disk, or a combination called disk-assisted. Here, we’ll use in-memory because they’re the fastest. For more information about how queues work, take a look here
Configuration
To generate messages, we used tcpflood, a small and light tool that’s part of rsyslog’s testbench. It generates messages and sends them over to the local syslog via TCP.
Rsyslog took received those messages with the imtcp input module, queued them and forwarded them to Elasticsearch 0.90.7, which was also installed locally. We also tried with Elasticsearch 1.0 and got the same results (see below).
The flow of messages in this test is represented in the following figure:

The actual rsyslog config is listed below (in the new configuration format). It can be tuned further (for example by using the multithreaded imptcp input module), but we didn’t get significant improvements in this particular scenario.
module(load="imtcp")   # TCP input module
module(load="omelasticsearch") # Elasticsearch output module

input(type="imtcp" port="13514")  # where to listen for TCP messages

main_queue(
  queue.size="1000000"   # capacity of the main queue
  queue.dequeuebatchsize="1000"  # process messages in batches of 1000 and move them to the action queues
  queue.workerthreads="2"  # 2 threads for the main queue
)

# template to generate JSON documents for Elasticsearch in Logstash format
template(name="plain-syslog"
         type="list") {
           constant(value="{")
             constant(value="\"@timestamp\":\"")      property(name="timereported" dateFormat="rfc3339")
             constant(value="\",\"host\":\"")        property(name="hostname")
             constant(value="\",\"severity\":\"")    property(name="syslogseverity-text")
             constant(value="\",\"facility\":\"")    property(name="syslogfacility-text")
             constant(value="\",\"syslogtag\":\"")   property(name="syslogtag" format="json")
             constant(value="\",\"message\":\"")    property(name="msg" format="json")
             constant(value="\"}")
         }

action(type="omelasticsearch"
       template="plain-syslog"  # use the template defined earlier
       searchIndex="test-index"
       bulkmode="on"                   # use the Bulk API
       queue.dequeuebatchsize="5000"   # ES bulk size
       queue.size="100000"   # capacity of the action queue
       queue.workerthreads="5"   # 5 workers for the action
       action.resumeretrycount="-1"  # retry indefinitely if ES is unreachable
)
You can see from the configuration that:
- both main and action queues have a defined size in number of messages
- both have number of threads that deliver messages to the next step. The action needs more because it has to wait for Elasticsearch to reply
- moving of messages from the queues happens in batches. For the Elasticsearch output, the batch of messages is sent through the Bulk API, which makes queue.dequeuebatchsize effectively the bulk size
Results
We started with default Elasticsearch settings. Then we tuned them to leave rsyslog with a more significant slice of the CPU. We monitored the indexing rate with SPM for Elasticsearch. Here are the average results over 20 million indexed events:
- with default Elasticsearch settings, we got 8,000 events per second
- after setting Elasticsearch up more production-like (5 second refresh interval, increased index buffer size, translog thresholds, etc), and the throughput went up to average of 20,000 events per second
- in the end, we went berserk and used in-memory indices, updated the mapping to disable any storing or indexing for any field, to have Elasticsearch do as little work as possible and make room for rsyslog. Got an average of 30,000 events per second. In this scenario, rsyslog was using between 1 and 1.5 of the 4 virtual CPU cores, with tcpflood using 0.5 and Elasticsearch using from 2 to 2.5
Conclusion
20K EPS on a low-end machine with production-like configuration means Elasticsearch is quick at indexing. This is very good for logs, where you typically have lots of messages being generated, compared to how often you search.
If you need some tool to ship your logs to Elasticsearch with minimum overhead, rsyslog version 8 may well be your best bet.
Related posts:
Output to Elasticsearch in Logstash format (Kibana-friendly)
Original post: Recipe rsyslog+Elasticsearch+Kibana by @Sematext
In this post you’ll see how you can take your logs with rsyslog and ship them directly to Elasticsearch (running on your own servers, or the one behind Logsene’s Elasticsearch API) in a format that plays nicely with Logstash. So you can use Kibana to search, analyze and make pretty graphs out of them.
This is especially useful when you have a lot of servers logging [a lot of data] to their syslog daemons and you want a way to search them quickly or do statistics on the logs. You can use rsyslog’s Elasticsearch output to get your logs into Elasticsearch, and Kibana to visualize them. The only challenge is to get your rsyslog configuration right, so your logs end up where Kibana is expecting them. And this is exactly what we’re doing here.
Getting all the ingredients
Here’s what you’ll need:
- a recent version of rsyslog (v8+ is recommended for best performance, although the Elasticsearch output is available since 6.4.0). You can download and compile it yourself, or you can get it from the RHEL/CentOS or Ubuntu repositories
- the Elasticsearch output plugin for rsyslog. If you compile rsyslog from sources, you’ll need to add the –enable-elasticsearch parameter to the configure script. If you use the repositories, just install the rsyslog-elasticsearch package
- Elasticsearch :). You have a DEB and a RPM there, which should get you started in no time. If you choose the tar.gz archive, you might find the installation instructions useful
- Kibana 3 and a web server to serve it. There are installation instructions on the GitHub page. To get started quickly, you can try the tar.gz archive from the download page that gets you Elasticsearch, too
Then, you’ll probably need to edit config.js to change the Elasticsearch host name from “localhost” to the actual FQDN of the host that’s running Elasticsearch. This applies even if Kibana is on the same machine as Elasticsearch. “localhost” only works if your browser is on the same machine as Elasticsearch, because Kibana talks to Elasticsearch directly from your browser.
Finally, you can serve the Kibana page with any HTTP server you prefer. If you want to get started quickly, you can try SimpleHTTPServer, which should be embedded to any recent Python, by running this command from the “kibana” directory:
python -m SimpleHTTPServer
Putting them all together
Kibana is, by default, expecting Logstash to send logs to Elasticsearch. So “putting them all together” here means “configuring rsyslog to send logs to Elasticsearch in the same manner Logstash does”. And Logstash, by default, has some particular ways when it comes to naming the indices and formatting the logs:
- indices should be formatted like logstash-YYYY.MM.DD. You can change the pattern Kibana is looking for, but we won’t do that here
- logs must have a timestamp, and that timestamp must be stored in the @timestamp field. It’s also nice to put the message part in the message field – because Kibana shows it by default
To satisfy the requirements above, here’s a rsyslog configuration that should work for sending your local syslog logs to Elasticsearch in a Logstash/Kibana-friendly way:
module(load="imuxsock")             # for listening to /dev/log
module(load="omelasticsearch") # for outputting to Elasticsearch
# this is for index names to be like: logstash-YYYY.MM.DD
template(name="logstash-index"
  type="list") {
    constant(value="logstash-")
    property(name="timereported" dateFormat="rfc3339" position.from="1" position.to="4")
    constant(value=".")
    property(name="timereported" dateFormat="rfc3339" position.from="6" position.to="7")
    constant(value=".")
    property(name="timereported" dateFormat="rfc3339" position.from="9" position.to="10")
}

# this is for formatting our syslog in JSON with @timestamp
template(name="plain-syslog"
  type="list") {
    constant(value="{")
      constant(value="\"@timestamp\":\"")     property(name="timereported" dateFormat="rfc3339")
      constant(value="\",\"host\":\"")        property(name="hostname")
      constant(value="\",\"severity\":\"")    property(name="syslogseverity-text")
      constant(value="\",\"facility\":\"")    property(name="syslogfacility-text")
      constant(value="\",\"tag\":\"")   property(name="syslogtag" format="json")
      constant(value="\",\"message\":\"")    property(name="msg" format="json")
    constant(value="\"}")
}
# this is where we actually send the logs to Elasticsearch (localhost:9200 by default)
action(type="omelasticsearch"
    template="plain-syslog"
    searchIndex="logstash-index"
    dynSearchIndex="on")
After restarting rsyslog, you can go to http://host-serving-Kibana:8000/ in your browser and start searching and graphing your logs:
More tips
Now that you got the essentials working, here are some tips that might help you go even further with your centralized logging setup:
- you might not want to put the new rsyslog and omelasticsearch on all your servers. In this case you can forward them over the network to a central rsyslog that has omelasticsearch, and push your logs to Elasticsearch from there. Some information on forwarding logs via TCP can be found here and here
- you might want rsyslog to buffer your logs (in memory, on disk, or some combination of the two), in case Elasticsearch is not available for some reason. Buffering will also help performance, as you can send messages in bulks instead of one by one. There’s a reference on buffers with rsyslog&omelasticsearch here
- you might want to parse JSON-formatted (CEE) syslog messages. If you’re using them, check our earlier post on the subject: JSON logging with rsyslog and Elasticsearch
You can also hook rsyslog up to a log analytics service like Logsene, by either shipping logs via omelasticsearch or by sending them via UDP/TCP/RELP syslog protocols.
rsyslog and ElasticSearch
by Micah Yoder, originally published on rackspace. Minor changes through Adiscon.
There is a clear benefit to being able to aggregate logs from various servers and services into one place and be able to search them for any sort of arbitrary event. Traditional syslog can aggregate logs, but aggregating events from them sometimes involves grep and convoluted regular expressions. Logging structured data to a database makes a lot of sense. rsyslog and ElasticSearch can do that, but figuring out how to get it to work from the rsyslog documentation can be difficult. Let’s start from the beginning.
First, you need the newest stable rsyslog, 7.4.x. The older 7.2 won’t cut it. You need the plug-ins mmnormalize and omelasticsearch, both of which are available from rsyslog’s yum repositories for RHEL/CentOS. mmnormalize requires some packages from EPEL so that will need to be added to the server as well.
Let’s walk through this from the beginning, starting with the most basic rsyslog configuration:
module(load="imuxsock") # provides support for local system logging (e.g. via logger command)
module(load="imklog")   # provides kernel logging support (previously done by rklogd)
$ActionFileDefaultTemplate RSYSLOG_TraditionalFileFormat
*.*     /var/log/messages
This simply loads the necessary modules for basic logging operation, sets the normal log format, and sends everything to /var/log/messages. With this if you issue this command:
# logger 'hello world!'
You get this in /var/log/messages:
Mar 27 14:16:47 micahsyslog root: hello world!
There are several parts here: the date/time, the hostname, the syslog tag or program (root), and the message. Another example:
# service sshd restart
yields:
Mar 27 14:19:27 micahsyslog sshd[23295]: Received signal 15; terminating.
Mar 27 14:19:27 micahsyslog sshd[16602]: Server listening on 0.0.0.0 port 22.
Mar 27 14:19:27 micahsyslog sshd[16602]: Server listening on :: port 22.
By the way, if we remove the ActionFileDefaultTemplate directive, we get the default line with an ISO time, which is nicer for automatic processing but a bit less readable for humans:
2013-03-27T21:51:29.139796+00:00 micahsyslog root: Hello world #2!
That is good to know, but actually irrelevant for putting data into ElasticSearch. If you also log to text files, you can decide whether to use the ISO time or the more human readable time.
Now let’s try to get it to normalize messages from the log! For this example we will need rsyslog running with ActionFileDefaultTemplate directive (keep it in for now, but you can remove it later if you want).
Create a rulebase file, which will be used by liblognorm. liblognorm is a library written by Rainer Gerhards, the author of rsyslog, which parses log messages according to a pattern and extracts variables from them. We can create the file as /etc/rsyslog.d/rules.rb and put in these contents:
prefix=%date:date-rfc3164% %hostname:word% %tag:word%
rule=user: new user: name=%user:char-to:,%, UID=%uid:number%, GID=%gid:number%, home=%home:char-to:,%, shell=%shell:word%
rule=test: Hello %x:number%
Now if we log something:
# logger “Hello 55”
We should be able to get something like this:
# lognormalizer -r rsyslog.d/rules.rb -t test < /var/log/messages
[cee@115 event.tags="test" x="55" tag="root:" hostname="micahsyslog" date="Mar 27 22:53:30"]
See what happened? The lognormalizer command, which uses liblognorm, was able to pull out the number in the log as variable “x” according to our “test” rule.
A short description of the rule base is in order. The prefix line contains a prefix that will be applied to all following rules. A rule is defined by a line beginning with the word “rule”, followed by an “=” sign, an optional tag, then a “:”. A space should then follow – but the space is actually part of the rule! There will be a space after the prefix, so it needs to be there.
Documentation on the rulebase file can be found here: http://www.liblognorm.com/files/manual/index.html Then navigate to How to use liblognorm → Rulebase. This will show you all the directives you can use.
Now we need to get the data into ElasticSearch. First we need to install it, which is very simple (at least for a single test node). Just extract its tarball, change into the base directory, and run:
# bin/elasticsearch -f
The -f causes it to run in the foreground so you can see what is going on.
We then add this to rsyslog.conf:
module(load="mmnormalize")
module(load="omelasticsearch")

template(name="test" type="subtree" subtree="$!")

set $!fac = $syslogfacility;
set $!host = $hostname;
set $!sev = $syslogseverity;
set $!time = $timereported;
set $!tgen = $timegenerated;
set $!tag = $syslogtag;
set $!prog = $programname;

action(type="omelasticsearch" server="localhost" template="test")
So what is all this? First we load the modules to normalize the log messages and for export to ElasticSearch. These should be placed near the top of your rsyslog.conf file with any other includes.
The template statement tells which part of the CEE data should be sent to ElasticSearch. Here a brief explanation of the data structure is necessary.
JSON (the format for CEE logging data and the native format for ElasticSearch) is a hierarchical data structure. The root of the data structure in rsyslog is $! – something like the ‘{}’ in a JSON document. Assigning to $!data1 would put a value into the “data1” top level JSON element {“data”: “…”}. Trees can be built. If you assign to $!tree1!child1, you will get a JSON document like this: {“tree1: {“child1”: “…”}}
This rsyslog document lists the available properties that you can use to populate these CEE variables.
As of version 7.5.8, 7.6.0 and 8.1.4, not only the standard rsyslog properties and constants can be assigned to these variables. There is now a way to assign the result of an rsyslog template, which allows more complex values. That is what you need to put a sortable timestamp into the document. More information can be found in the guide to use “set variable and exec_template“.
As this was not available at the time of writing I needed to get around this limitation (sort of), so I created an ElasticSearch index with a timestamp. Here is the command I used:
curl -XPUT http://elasticsearch.hostname:9200/logs -d '{"mappings":{"events":{"_timestamp":{"enabled": true, "store": "yes"},"prog":{"store":"yes"},"host":{"store":"yes"}}}}'
This also “stores” the host and prog syslog fields, which should help with querying based on the host or program. This will create an index called “logs”. ElasticSearch by default inserts events into the “system” index so you will want to specify the index name in your omelasticsearch line in rsyslog.conf (or one of its includes):
action(type="omelasticsearch" server="elasticsearch.hostname" template="cee_template_name" searchIndex="logs" bulkmode="on")
We also enabled bulk mode, which allows rsyslog to send many events at once to ElasticSearch. This will greatly improve performance.
Now you can query it!
curl 'http://elasticsearch.hostname:9200/logs/_search?pretty=1&fields=_source,_timestamp&size=100' -d '{"sort":{"_timestamp": "desc"}}' | less
The “pretty=1” and piping it to less are simply there to pretty print the JSON result and make it easy for you to browse the data set. A real search program, of course, would not turn on pretty mode and the code would directly consume the JSON.
You can add parameters after the ‘size=100’ (which, of course, says to return the 100 most recent results).
- &q=word will search the logs for that word in any field.
- &q=prog:name will search for ‘name’ in the syslog program field. Examples: postfix, sudo, crontab
- &q=host:hostname will find events for that hostname. Just use the base hostname, not a FQDN.
And that should get you started! Hopefully this is helpful.