Tutorial: Sending impstats Metrics to Elasticsearch Using Rulesets and Queues
Originally posted on the Sematext blog: Monitoring rsyslog’s Performance with impstats and Elasticsearch
If you’re using rsyslog for processing lots of logs (and, as we’ve shown before, rsyslog is good at processing lots of logs), you’re probably interested in monitoring it. To do that, you can use impstats, which comes from input module for process stats. impstats produces information like:
– input stats, like how many events went through each input
– queue stats, like the maximum size of a queue
– action (output or message modification) stats, like how many events were forwarded by each action
– general stats, like CPU time or memory usage
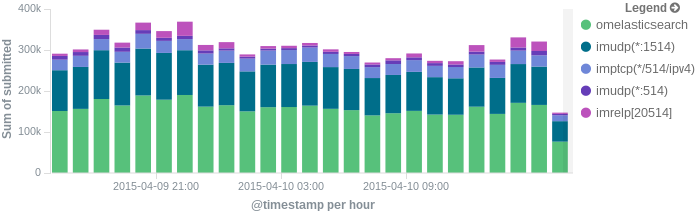
In this post, we’ll show you how to send those stats to Elasticsearch (or Logsene — essentially hosted ELK, our log analytics service, that exposes the Elasticsearch API), where you can explore them with a nice UI, like Kibana. For example get the number of logs going through each input/output per hour:
More precisely, we’ll look at:
– useful options around impstats
– how to use those stats and what they’re about
– how to ship stats to Elasticsearch/Logsene by using rsyslog’s Elasticsearch output
– how to do this shipping in a fast and reliable way. This will apply to most rsyslog use-cases, not only impstats
Continue reading “Tutorial: Sending impstats Metrics to Elasticsearch Using Rulesets and Queues”
Using rsyslog and Elasticsearch to Handle Different Types of JSON Logs
Originally posted on the Sematext blog: Using Elasticsearch Mapping Types to Handle Different JSON Logs
By default, Elasticsearch does a good job of figuring the type of data in each field of your logs. But if you like your logs structured like we do, you probably want more control over how they’re indexed: is time_elapsed an integer or a float? Do you want your tags analyzed so you can search for big in big data? Or do you need it not_analyzed, so you can show top tags via the terms aggregation? Or maybe both?
In this post, we’ll look at how to use index templates to manage multiple types of logs across multiple indices. Also, we’ll explain how to use rsyslog to handle JSON logging and specify types.
Elasticsearch Mapping and Logs
To control settings for how a field is analyzed in Elasticsearch, you’ll need to define a mapping. This works similarly in Logsene, our log analytics SaaS, because it uses Elasticsearch and exposes its API.
With logs you’ll probably use time-based indices, because they scale better (in Logsene, for instance, you get daily indices). To make sure the mapping you define today applies to the index you create tomorrow, you need to define it in an index template.
Managing Multiple Types
Mappings provide a nice abstraction when you have to deal with multiple types of structured data. Let’s say you have two apps generating logs of different structures: both have a timestamp field, but one recording logins has a user field, and another one recording purchases has an amount field.
To deal with this, you can define the timestamp field in the _default_ mapping which applies to all types. Then, in each type’s own mapping we’ll define fields unique to that mapping. The following snippet is an example that works with Logsene, provided that aaaaaaaa-bbbb-cccc-dddd-eeeeeeeeeeee is your Logsene app token. If you roll your own Elasticsearch, you can use whichever name you want, and make sure the template name applies to matches index pattern (for example, logs-* will work if your indices are in the logs-YYYY-MM-dd format).
curl -XPUT 'logsene-receiver.sematext.com/_template/aaaaaaaa-bbbb-cccc-dddd-eeeeeeeeeeee_MyTemplate' -d '{
 "template" : "aaaaaaaa-bbbb-cccc-dddd-eeeeeeeeeeee*",
 "order" : 21,
 "mappings" : {
  "_default_" : {
   "properties" : {
    "timestamp" : { "type" : "date" }
   }
  },
  "firstapp" : {
   "properties" : {
    "user" : { "type" : "string" }
   }
  },
  "secondapp" : {
   "properties" : {
    "amount" : { "type" : "long" }
   }
  }
 }
}'
Sending JSON Logs to Specific Types
When you send a document to Elasticsearch by using the API, you have to provide an index and a type. You can use an Elasticsearch client for your preferred language to log directly to Elasticsearch or Logsene this way. But I wouldn’t recommend this, because then you’d have to manage things like buffering if the destination is unreachable.
Instead, I’d keep my logging simple and use a specialized logging tool, such as rsyslog, to do the hard work for me. Logging to a file is usually the easiest option. It’s local, and you can have your logging tool tail the file and send contents over the network. I usually prefer sockets (like syslog) because they let me configure rsyslog to:
– write events in a human format to a local file I can tail if I need to (usually in development)
– forward logs without hitting disk if I need to (usually in production)
Whatever you prefer, I think writing to local files or sockets is better than sending logs over the network from your application. Unless you’re willing to do a reliability trade-off and use UDP, which gets rid of most complexities.
Opinions aside, if you want to send JSON over syslog, there’s the JSON-over-syslog (CEE) format that we detailed in a previous post. You can use rsyslog’s JSON parser module to take your structured logs and forward them to Logsene:
module(load="imuxsock")        # can listen to local syslog socket
module(load="omelasticsearch") # can forward to Elasticsearch
module(load="mmjsonparse")     # can parse JSON

action(type="mmjsonparse")  # parse CEE-formatted messages

template(name="syslog-cee" type="list") {  # Elasticsearch documents will contain
  property(name="$!all-json")              # all JSON fields that were parsed
}

action(
  type="omelasticsearch"
  template="syslog-cee"                     # use the template defined earlier
  server="logsene-receiver.sematext.com"
  serverport="80"
  searchType="syslogapp"
  searchIndex="LOGSENE-APP-TOKEN-GOES-HERE"
  bulkmode="on"                                # send logs in batches
  queue.dequeuebatchsize="1000"                # of up to 1000
  action.resumeretrycount="-1"    # retry indefinitely (buffer) if destination is unreachable
)
To send a CEE-formatted syslog, you can run logger ‘@cee: {“amount”: 50}’ for example. Rsyslog would forward this JSON to Elasticsearch or Logsene via HTTP. Note that Logsene also supports CEE-formatted JSON over syslog out of the box if you want to use a syslog protocol instead of the Elasticsearch API.
Filtering by Type
Once your logs are in, you can filter them by type (via the _type field) in Kibana:

However, if you want more refined filtering by source, we suggest using a separate field for storing the application name. This can be useful when you have different applications using the same logging format. For example, both crond and postfix use plain syslog.
Parsing JSON (CEE) Logs and Sending them to Elasticsearch
Original post: Structured Logging with rsyslog and Elasticsearch via @sematext
When your applications generate a lot of logs, you’d probably want to make some sense of them through searches and statistics. Here’s when structured logging comes in handy, and I would like to share some thoughts and configuration examples of how you could use a popular syslog daemon like rsyslog to handle both structured and unstructured logs. Then I’ll show you how to:
- take a JSON from a syslog message and index it in Elasticsearch (which eats JSON documents)
- append other syslog properties (like the date) to the existing JSON to make a bigger JSON document that would be indexed in Elasticsearch. This is how we set up rsyslog to handle CEE-formatted messages in our log analytics tool, Logsene
On structured logging
If we take an unstructured log message, like:
Joe bought 2 apples
And compare it with a similar one in JSON, like:
{“name”: “Joe”, “action”: “bought”, “item”: “apples”, “quantity”: 2}
We can immediately spot a good and a bad point of structured logging: if we index these logs, it will be faster and more precise to search for “apples” in the “item” field, rather than in the whole document. At the same time, the structured log will take up more space than the unstructured one.
But in most use-cases there will be more applications that would log the same subset of fields. So if you want to search for the same user across those applications, it’s nice to be able to pinpoint the “name” field everywhere. And when you add statistics, like who’s the user buying most of our apples, that’s when structured logging really becomes useful.
Finally, it helps to have a structure when it comes to maintenance. If a new version of the application adds a new field, and your log becomes:
Joe bought 2 red apples
it might break some log-parsing, while structured logs rarely suffer from the same problem.
Enter CEE and Lumberjack: structured logging with syslog
With syslog, as defined by RFC3164, there is already a structure in the sense that there’s a priority value (severity*8 + facility), a header (timestamp and hostname) and a message. But this usually isn’t the structure we’re looking for.
CEE and Lumberjack are efforts to introduce structured logging to syslog in a backwards-compatible way. The process is quite simple: in the message part of the log, one would start with a cookie string “@cee:”, followed by an optional space and then a JSON or XML. From this point on I will talk about JSON, since it’s the format that both rsyslog and Elasticsearch prefer. Here’s a sample CEE-enhanced syslog message:
@cee: {“foo”: “bar”}
This makes it quite easy to use CEE-enhanced syslog with existing syslog libraries, although there are specific libraries like liblumberlog, which make it even easier. They’ve also defined a list of standard fields, and applications should use those fields where they’re applicable – so that you get the same field names for all applications. But the schema is free, so you can add custom fields at will.
CEE-enhanced syslog with rsyslog
rsyslog has a module named mmjsonparse for handling CEE-enhanced syslog messages. It checks for the “CEE cookie” at the beginning of the message, and then tries to parse the following JSON. If all is well, the fields from that JSON are loaded and you can then use them in templates to extract whatever information seems important. Fields from your JSON can be accessed like this: $!field-name. An example of how they can be used is shown here.
To get started, you need to have at least rsyslog version 6.6.0, and I’d recommend using version 7 or higher. If you don’t already have that, check out the repositories for RHEL/CentOS and Ubuntu.
Also, mmjsonparse is not enabled by default. If you use the repositories, install the rsyslog-mmjsonparse package. If you compile rsyslog from sources, specify –enable-mmjsonparse when you run the configure script. In order for that to work you’d probably have to install libjson and liblognorm first, depending on your operating system.
For a proof of concept, we can take this config:
#load needed modules
module(load="imuxsock") # provides support for local system logging
module(load="imklog") # provides kernel logging support
module(load="mmjsonparse") #for parsing CEE-enhanced syslog messages

#try to parse structured logs
*.* :mmjsonparse:

#define a template to print field "foo"
template(name="justFoo" type="list") {
  property(name="$!foo")
  constant(value="\n") #we'll separate logs with a newline
}

#and now let's write the contents of field "foo" in a file
*.* action(type="omfile"
           template="justFoo"
           file="/var/log/foo")
To see things, better, you can start rsyslog in foreground and in debug mode:
rsyslogd -dn
And in another terminal, you can send a structured log, then see the value in your file:
# logger ‘@cee: {“foo”:”bar”}’
# cat /var/log/foo
bar
If we send an unstructured log, or an invalid JSON, nothing will be added
# logger ‘test’
# logger ‘@cee: test2’
# cat /var/log/foo
bar
But you can see in the debug output of rsyslog why:
mmjsonparse: no JSON cookie: ‘test’
[…]
mmjsonparse: toParse: ‘ test2’
mmjsonparse: Error parsing JSON ‘ test2’: boolean expected
Indexing logs in Elasticsearch
To index our logs in Elasticsearch, we will use an output module of rsyslog called omelasticsearch. Like mmjsonparse, it’s not compiled by default, so you will have to add the –enable-elasticsearch parameter to the configure script to get it built when you run make. If you use the repositories, you can simply install the rsyslog-elasticsearch package.
omelasticsearch expects a valid JSON from your template, to send it via HTTP to Elasticsearch. You can select individual fields, like we did in the previous scenario, but you can also select the JSON part of the message via the $!all-json property. That would produce the message part of the log, without the “CEE cookie”.
The configuration below should be good for inserting the syslog message to an Elasticsearch instance running on localhost:9200, under the index “system” and type “events“.
#load needed modules
module(load="imuxsock") # provides support for local system logging
module(load="imklog") # provides kernel logging support
module(load="mmjsonparse") #for parsing CEE-enhanced syslog messages
module(load="omelasticsearch") #for indexing to Elasticsearch

#try to parse a structured log
*.* :mmjsonparse:

#define a template to print all fields of the message
template(name="messageToES" type="list") {
  property(name="$!all-json")
}

#write the JSON message to the local ES node
*.* action(type="omelasticsearch"
           template="messageToES")
After restarting rsyslog, you can see your JSON will be indexed:
# logger ‘@cee: {“foo”: “bar”, “foo2”: “bar2″}’
# curl -XPOST localhost:9200/system/events/_search?q=foo2:bar2 2>/dev/null | sed s/.*_source//
” : { “foo”: “bar”, “foo2”: “bar2” }}]}}
As for unstructured logs, $!all-json will produce a JSON with a field named “msg”, having the message as a value:
# logger test
# curl -XPOST localhost:9200/system/events/_search?q=test 2>/dev/null | sed s/.*_source//
” : { “msg”: “test” }}]}}
It’s “msg” because that’s rsyslog’s property name for the syslog message.
Including other properties
But the message isn’t the only interesting property. I would assume most would want to index other information, like the timestamp, severity, or host which generated that message.
To do that, one needs to play with templates and properties. In the future it might be made easier, but at the time of this writing (rsyslog 7.2.3), you need to manually craft a valid JSON to pass it to omelasticsearch. For example, if we want to add the timestamp and the syslogtag, a working template might look like this:
template(name="customTemplate"
   type="list") {
#- open the curly brackets,
#- add the timestamp field surrounded with quotes
#- add the colon which separates field from value
#- open the quotes for the timestamp itself
   constant(value="{\"timestamp\":\"")
#- add the timestamp from the log,
# format it in RFC-3339, so that ES detects it by default
   property(name="timereported" dateFormat="rfc3339")
#- close the quotes for timestamp,
#- add a comma, then the syslogtag field in the same manner
   constant(value="\",\"syslogtag\":\"")
#- now the syslogtag field itself
# and format="json" will ensure special characters
# are escaped so they won't break our JSON
   property(name="syslogtag" format="json")
#- close the quotes for syslogtag
#- add a comma
#- then add our JSON-formatted syslog message,
# but start from the 2nd position to omit the left
# curly bracket
   constant(value="\",")
   property(name="$!all-json" position.from="2")
}
Summary
If you’re interested in searching or analyzing lots of logs, structured logging might help. And you can do it with the existing syslog libraries, via CEE-enhanced syslog. If you use a newer version of rsyslog, you can parse these logs with mmjsonparse and index them in Elasticsearch with omelasticsearch. If you are interested in indexing/searching logs in general, check out other Sematext logging posts or follow @sematext.
Using MongoDB with rsyslog and LogAnalyzer
In this scenario we want to receive cee-formatted messages from a different system with rsyslog, store the messages with MongoDB and then display the stored messages with Adiscon LogAnalyzer. This is a very common use-case. Please read through the complete guide before starting.
We will split this guide in 3 main parts. These parts can consist of several steps.
- Setting up rsyslog
- Setting up MongoDB
- Setting up LogAnalyzer
This guide has been created with rsyslog 7.3.6 on ubuntu 12.04 LTS and Adiscon LogAnalyzer 3.6.3. All additional packages, services or applications where the latest version at that time.
Before you begin
Please note, there are many ways to distribute rsyslog. But, make sure that the platform you build rsyslog on is the same platform as where it should be used. You cannot build rsyslog on CentOS and use it on Ubuntu. The differences between the platforms are just to big. The same applies to different versions of the same platform. When building on a older platform and using it on a newer version, this may work, but with restrictions. Whereas building on a newer version and using it on a older version will probably not work at all. So, if you build rsyslog from Source and want to use it on another machine, make sure the platform is the same.
Step 1 – Setting up rsyslog
We need to setup rsyslog first. Not only do we need the core functionality, but several additional modules. For this case we want to receive the syslog messages via TCP, thus we need imtcp. For processing we need first mmjsonparse and ommongodb. Your configure should look like this.
./configure --prefix=/usr --enable-imtcp --enable-mmjsonparse --enable-ommongodb
The module mmjsonparse will be needed to verify and parse the @cee messages. Ommongodb will be used to write into the MongoDB. After the configure and installation, we can create our config. The config for our case looks like this:
module(load="imtcp")
module(load="mmjsonparse")
module(load="ommongodb")
input(type="imtcp" port="13514" Ruleset="mongodb")
template(name="mongodball" type="subtree" subtree="$!")
ruleset(name="mongodb") {
        action(type="mmjsonparse")
        if $parsesuccess == "OK" then {
                set $!time = $timestamp;
                set $!sys = $hostname;
                set $!procid = $syslogtag;
                set $!syslog_fac = $syslogfacility;
                set $!syslog_sever = $syslogpriority;
                set $!pid = $procid;
                action(type="ommongodb" server="127.0.0.1" db="logs" collection="syslog" template="mongodball")
                }
        }
As always, we first load the modules. The next part is the input. We need to receive tcp via imtcp. Please note, that we directly bind the input to a ruleset. The third part of the configuration is a template. We need it later when writing to MongoDB. Since we will automatically transform our @cee-message into json, we can use a subtree template. The template itself is basically the root of the subtree.
The last and most important part is the ruleset. Here all of our work is done. First, all messages are run through the mmjsonparse module. This will not only verify if we received a valid json message, but also transforms all the values into a json subtree. If the parsing was successful, we need to set several variables for the subtree. Information that is delivered in the syslog header will not be parsed into the subtree by mmjsonparse automatically. Thus we have to set subtree variables with the values of some default properties like timestamp, hostname and so on. After that we have basically all information from the complete syslog message in the subtree format. Finally a last action is needed. We need to write our log messages to MongoDB. In this example, MongoDB is installed on the same machine. We want to use the db “logs” and as collection we want to use “syslog”. And we use our subtree template to define the format that is written to MongoDB. Thus, all our parsed variables are stored separately. If we do not use this template, the @cee message gets written as it is into the msg field in MongoDB. But this is not what we want. We want all variables to be available separately.
That is basically it for rsyslog. You can now save the configuration and restart rsyslog. Though it won’t be able to be useful yet. We still need to install MongoDB.
Step 2 – Install MongoDB
Making a basic install for MongoDB is rather easy. Simply install the following packages:
mongodb
mongodb-server
php-pecl-mongo
libmongo-client
libglib2.0-dev
Please note, that package names may vary for different distributions.
After we have installed the packages, the MongoDB Server is already ready. By default, it is not secured by a user or password. Refer to the MongoDB manual for more information. Databases and collections (equivalent to tables) are created by rsyslog and do not need to be defined with the mongo shell. We will stick with the default setup to keep it simple.
Step 3 – Installing Adiscon LogAnalyzer
To run Adiscon LogAnalyzer, you need a webserver with PHP. The easiest way is to use apache2 and php5. To be able to access the MongoDB, we need to install an additional package. Run the following command
sudo pecl install mongo
You might need to install the package php-pear first, if it hasn’t been installed already with PHP.
After that, we need to put the following line into the file php.ini.
extension=mongo.so
Remember to restart your webserver after making changes to the php.ini. Without a lot of configuration, this should aready work.
We can now install Adiscon LogAnalyzer. Download the latest version from the Adiscon LogAnalyzer Download page and install it as it is described in the documentation.
The only difference we need to make is when setting up the log source in step 4.5. You need to set at least the following as shown in the screenshot:
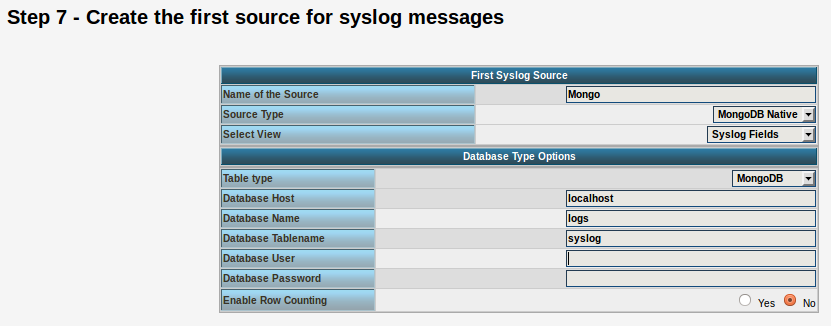
Source Type: MongoDB Native
Table Type: MongoDB
Database Name: logs
Database Tablename: syslog
Database user: <clear this field>
The User and Password is of course needed, if you set it in your MongoDB setup.
After you have finished the installation of Adiscon LogAnalyzer, you should now be seeing the LogAnalyzer overview and the log messages in a table view (if you have already stored them in MongoDB). Now if you click on a specific message, you get to see the detail view of the log message.
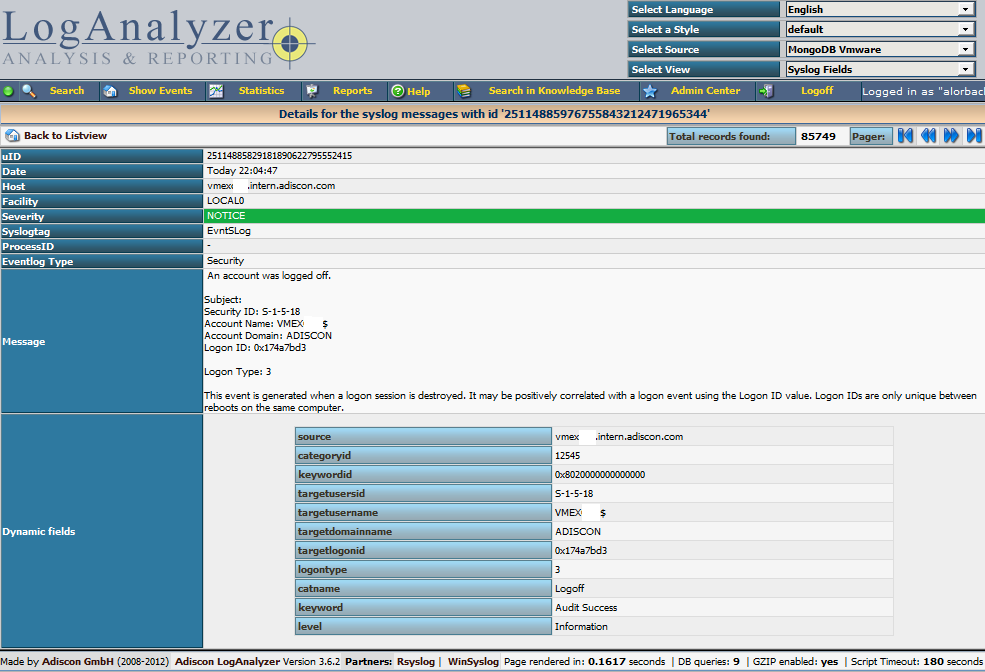
Click on the picture for a bigger size
As you can see, you get a list of dynamic fields. These fields where already sent in @cee format from the original source and were parsed by rsyslog and mmjsonparse and finally they were automatically filled into the MongoDB.
With this setup, you are independent of a fixed database structure. Fields are inserted dynamically into the database as they are available and they are dynamically display by Adiscon LogAnalyzer as well.
rsyslog 7.3.1 (v7-devel) released
We have just released 7.3.1 of the v7-devel branch. This version increases template processing speed, for the $NOW-family of properties very considerably. It also contains a compatibility change in regard to lumberjack structured logging.
ChangeLog:
http://www.rsyslog.com/changelog-for-7-3-1-v7-devel/
Download:
http://www.rsyslog.com/rsyslog-7-3-1-v7-devel/
As always, feedback is appreciated.
Best regards,
Florian Riedl
rsyslog 7.3.1 (v7-devel)
Download file name: rsyslog 7.3.1 (devel)
rsyslog 7.3.1 (devel)
sha256 hash: f893188c8aa6e9728478e765b2fd4132e11b6d6a7e8e46f87b624cc9aa5ef538
Author: Rainer Gerhards (rgerhards@adiscon.com)
Version: 7.3.1 File size: 2.697 MB
Changelog for 7.3.1 (v7-devel)
Version 7.3.1 [devel] 2012-10-19
- optimized template processing performance, especially for $NOW family of properties
- change lumberjack cookie to “@cee:” from “@cee: ”
CEE originally specified the cookie with SP, whereas other lumberjack tools used it without space. In order to keep interop with lumberjack, we now use the cookie without space as well. I hope this can be changed in CEE as well when it is released at a later time.
Thanks to Miloslav Trmač for pointing this out and a similiar v7 patch. - bugfix: imuxsock and imklog truncated head of received message
This happened only under some circumstances. Thanks to Marius
Tomaschwesky, Florian Piekert and Milan Bartos for their help in solving this issue. - bugfix: imuxsock did not properly honor $LocalHostIPIF
Changelog for 7.1.11 (v7-beta)
Version 7.1.11 [beta] 2012-10-16
- bugfix: imuxsock truncated head of received message
This happened only under some circumstances. Thanks to Marius Tomaschwesky, Florian Piekert and Milan Bartos for their help in solving this issue. - bugfix: do not crash if set statement is used with date field
Thanks to Miloslav Trmač for the patch. - change lumberjack cookie to “@cee:” from “@cee: ”
CEE originally specified the cookie with SP, whereas other lumberjack tools used it without space. In order to keep interop with lumberjack, we now use the cookie without space as well. I hope this can be changed in CEE as well when it is released at a later time.
Thanks to Miloslav Trmač for pointing this out and a similiar v7 patch. - added deprecated note to omruleset (plus clue to use “call”)
- added deprecated note to discard action (plus clue to use “stop”)
rsyslog 6.5.1 (beta)
Download
file name: rsyslog 6.5.1 (beta)
rsyslog 6.5.1 (beta) md5sum: e6f8ef3dc1acdb5b7f64a1046b7e8a8f5a4f39bc1ebd1bf02eb092394a6774b4
Author: Rainer Gerhards (rgerhards@adiscon.com)
Version: 6.5.1
File size: 2.55 MB
Download this file now!
Changelog for 6.5.1 (v6-beta)
Version 6.5.1 [BETA] 2012-10-11
- added tool “logctl” to handle lumberjack logs in MongoDB
- imfile ported to new v6 config interface
- imfile now supports config parameter for maximum number of submits
which is a fine-tuning parameter in regard to input baching - added pure JSON output plugin parameter passing mode
- ommongodb now supports templates
- bugfix: imtcp could abort on exit due to invalid free()
- bugfix: remove invalid socket option call from imuxsock
Thanks to Cristian Ionescu-Idbohrn and Jonny Törnbom - bugfix: missing support for escape sequences in RainerScript
only \’ was supported. Now the usual set is supported. Note that v5
used \x as escape where x was any character (e.g. “\n” meant “n” and NOT
LF). This also means there is some incompatibility to v5 for well-know
sequences. Better break it now than later. - bugfix: small memory leaks in template() statements
these were one-time memory leaks during startup, so they did NOT grow
during runtime - bugfix: config validation run did not always return correct return state
- bugfix: config errors did not always cause statement to fail
This could lead to startup with invalid parameters.