json

Coupling with Logstash via Redis

Original post: Recipe: rsyslog + Redis + Logstash by @Sematext

OK, so you want to hook up rsyslog with Logstash. If you don’t remember why you want that, let me give you a few hints:

  • Logstash can do lots of things, it’s easy to set up but tends to be too heavy to put on every server
  • you have Redis already installed so you can use it as a centralized queue. If you don’t have it yet, it’s worth a try because it’s very light for this kind of workload.
  • you have rsyslog on pretty much all your Linux boxes. It’s light and surprisingly capable, so why not make it push to Redis in order to hook it up with Logstash?

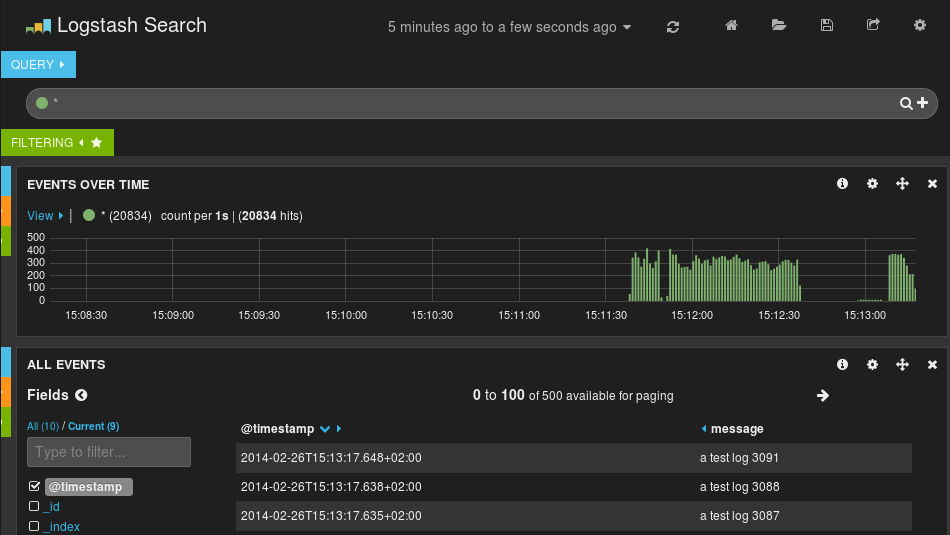
In this post, you’ll see how to install and configure the needed components so you can send your local syslog (or tail files with rsyslog) to be buffered in Redis so you can use Logstash to ship them to Elasticsearch, a logging SaaS like Logsene (which exposes the Elasticsearch API for both indexing and searching) so you can search and analyze them with Kibana:

Kibana_search

Continue reading “Coupling with Logstash via Redis”

Tutorial: Sending impstats Metrics to Elasticsearch Using Rulesets and Queues

Originally posted on the Sematext blog: Monitoring rsyslog’s Performance with impstats and Elasticsearch

If you’re using rsyslog for processing lots of logs (and, as we’ve shown before, rsyslog is good at processing lots of logs), you’re probably interested in monitoring it. To do that, you can use impstats, which comes from input module for process stats. impstats produces information like:
input stats, like how many events went through each input
queue stats, like the maximum size of a queue
– action (output or message modification) stats, like how many events were forwarded by each action
– general stats, like CPU time or memory usage

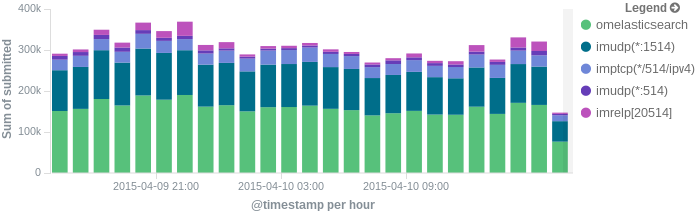
In this post, we’ll show you how to send those stats to Elasticsearch (or Logsene — essentially hosted ELK, our log analytics service, that exposes the Elasticsearch API), where you can explore them with a nice UI, like Kibana. For example get the number of logs going through each input/output per hour:
kibana_graph
More precisely, we’ll look at:
– useful options around impstats
– how to use those stats and what they’re about
– how to ship stats to Elasticsearch/Logsene by using rsyslog’s Elasticsearch output
– how to do this shipping in a fast and reliable way. This will apply to most rsyslog use-cases, not only impstats

Continue reading “Tutorial: Sending impstats Metrics to Elasticsearch Using Rulesets and Queues”

rsyslog 8.3.1 (v8-devel) released

We have just released 8.3.1 of the v8-devel branch.

This release provides some improvements for external message modification modules, a module to rewrite message facility and severity as well as bug fixes. It is a recommended update for all v8.3 users.

ChangeLog:

http://www.rsyslog.com/changelog-for-8-3-1-v8-devel/

Download:

http://www.rsyslog.com/download-v8-devel/

As always, feedback is appreciated.

Best regards,
Florian Riedl

Changelog for 8.3.1 (v8-devel)

Version 8.3.1 [v8-devel] 2014-04-24

  • external message modification interface now support modifying message PRI
  • “jsonmesg” property will include uuid only if one was previously generated
    This is primarily a performance optimization. Whenever the message uuid is gotten, it is generated when not already present. As we used the regular setter, this means that always the uuid was generated, which is quite time-consuming. This has now been changed so that it only is generated if it already exists. That also matches more closly the semantics, as “jsonmesg” should not make modifications to the message.
    Note that the same applies to “fulljson” passing mode for external plugins.
  • added plugin to rewrite message facility and/or severity
    Name: fac-sever-rewrite.py
  • permits to build against json-c 0.12
    Unfortunately, json-c had an ABI breakage, so this is necessary. Note that versions prior to 0.12 had security issues (CVE-2013-6370, CVE-2013-6371) and so it is desirable to link against the new version.
    Thanks to Thomas D. for the patch.
    Note that at least some distros have fixed the security issue in older versions of json-c, so this seems to apply mostly when building from sources.
  • bugfix: using UUID property could cause segfault
  • bugfix/mmexternal: memory leak
  • bugfix: memory leak when using “jsonmesg” property
  • bugfix: mmutf8fix did not detect two invalid sequences
    Thanks to Axel Rau for the patch.
  • bugfix: build problems with lexer.l on some platforms
    For some reason, the strdup() prototype and others are missing. I admit that I don’t know why, as this happens only in 8.3.0+ and there is no indication of changes to the affected files. In any case, we need to fix this, and the current solution works at least as an interim one.

Changelog for 8.3.0 (v8-devel)

Version 8.3.0 [v8-devel] 2014-04-10

  • new plugin for anonymizing credit card numbers
    Thanks to Peter Slavov for providing the code.
  • external message modification modules are now supported
    They are bound via the new native module “mmexternal”. Also, a sample skeleton for an external python message modification module has been added.
  • new $jsonmesg property with JSON representation of whole message object
    closes: https://github.com/rsyslog/rsyslog/issues/19
  • improved error message for invalid field extraction in string template
    see also:
    http://kb.monitorware.com/problem-with-field-based-extraction-t12299.html
  • fix build problems on Solaris
  • NOTE: a json-c API that we begun to use requires the compiler to be in c99 mode. By default, we select it automatically. If you modify this and use gcc, be sure to include “-std=c99” in your compiler flags. This seems to be necessary only for older versions of gcc.

Output to Elasticsearch in Logstash format (Kibana-friendly)

Original post: Recipe rsyslog+Elasticsearch+Kibana by @Sematext

In this post you’ll see how you can take your logs with rsyslog and ship them directly to Elasticsearch (running on your own servers, or the one behind Logsene’s Elasticsearch API) in a format that plays nicely with Logstash. So you can use Kibana to search, analyze and make pretty graphs out of them.

This is especially useful when you have a lot of servers logging [a lot of data] to their syslog daemons and you want a way to search them quickly or do statistics on the logs. You can use rsyslog’s Elasticsearch output to get your logs into Elasticsearch, and Kibana to visualize them. The only challenge is to get your rsyslog configuration right, so your logs end up where Kibana is expecting them. And this is exactly what we’re doing here.

Getting all the ingredients

Here’s what you’ll need:

  • a recent version of rsyslog (v8+ is recommended for best performance, although the Elasticsearch output is available since 6.4.0). You can download and compile it yourself, or you can get it from the RHEL/CentOS or Ubuntu repositories
  • the Elasticsearch output plugin for rsyslog. If you compile rsyslog from sources, you’ll need to add the –enable-elasticsearch parameter to the configure script. If you use the repositories, just install the rsyslog-elasticsearch package
  • Elasticsearch :). You have a DEB and a RPM there, which should get you started in no time. If you choose the tar.gz archive, you might find the installation instructions useful
  • Kibana 3 and a web server to serve it. There are installation instructions on the GitHub page. To get started quickly, you can try the tar.gz archive from the download page that gets you Elasticsearch, too

Then, you’ll probably need to edit config.js to change the Elasticsearch host name from “localhost” to the actual FQDN of the host that’s running Elasticsearch. This applies even if Kibana is on the same machine as Elasticsearch. “localhost” only works if your browser is on the same machine as Elasticsearch, because Kibana talks to Elasticsearch directly from your browser.

Finally, you can serve the Kibana page with any HTTP server you prefer. If you want to get started quickly, you can try SimpleHTTPServer, which should be embedded to any recent Python, by running this command from the “kibana” directory:

python -m SimpleHTTPServer

Putting them all together

Kibana is, by default, expecting Logstash to send logs to Elasticsearch. So “putting them all together” here means “configuring rsyslog to send logs to Elasticsearch in the same manner Logstash does”. And Logstash, by default, has some particular ways when it comes to naming the indices and formatting the logs:

  • indices should be formatted like logstash-YYYY.MM.DD. You can change the pattern Kibana is looking for, but we won’t do that here
  • logs must have a timestamp, and that timestamp must be stored in the @timestamp field. It’s also nice to put the message part in the message field – because Kibana shows it by default

To satisfy the requirements above, here’s a rsyslog configuration that should work for sending your local syslog logs to Elasticsearch in a Logstash/Kibana-friendly way:

module(load="imuxsock")             # for listening to /dev/log
module(load="omelasticsearch") # for outputting to Elasticsearch
# this is for index names to be like: logstash-YYYY.MM.DD
template(name="logstash-index"
  type="list") {
    constant(value="logstash-")
    property(name="timereported" dateFormat="rfc3339" position.from="1" position.to="4")
    constant(value=".")
    property(name="timereported" dateFormat="rfc3339" position.from="6" position.to="7")
    constant(value=".")
    property(name="timereported" dateFormat="rfc3339" position.from="9" position.to="10")
}

# this is for formatting our syslog in JSON with @timestamp
template(name="plain-syslog"
  type="list") {
    constant(value="{")
      constant(value="\"@timestamp\":\"")     property(name="timereported" dateFormat="rfc3339")
      constant(value="\",\"host\":\"")        property(name="hostname")
      constant(value="\",\"severity\":\"")    property(name="syslogseverity-text")
      constant(value="\",\"facility\":\"")    property(name="syslogfacility-text")
      constant(value="\",\"tag\":\"")   property(name="syslogtag" format="json")
      constant(value="\",\"message\":\"")    property(name="msg" format="json")
    constant(value="\"}")
}
# this is where we actually send the logs to Elasticsearch (localhost:9200 by default)
action(type="omelasticsearch"
    template="plain-syslog"
    searchIndex="logstash-index"
    dynSearchIndex="on")

After restarting rsyslog, you can go to http://host-serving-Kibana:8000/ in your browser and start searching and graphing your logs:

kibana-screenshot

More tips

Now that you got the essentials working, here are some tips that might help you go even further with your centralized logging setup:

  • you might not want to put the new rsyslog and omelasticsearch on all your servers. In this case you can forward them over the network to a central rsyslog that has omelasticsearch, and push your logs to Elasticsearch from there. Some information on forwarding logs via TCP can be found here and here
  • you might want rsyslog to buffer your logs (in memory, on disk, or some combination of the two), in case Elasticsearch is not available for some reason. Buffering will also help performance, as you can send messages in bulks instead of one by one. There’s a reference on buffers with rsyslog&omelasticsearch here
  • you might want to parse JSON-formatted (CEE) syslog messages. If you’re using them, check our earlier post on the subject: JSON logging with rsyslog and Elasticsearch

You can also hook rsyslog up to a log analytics service like Logsene, by either shipping logs via omelasticsearch or by sending them via UDP/TCP/RELP syslog protocols.

Parsing JSON (CEE) Logs and Sending them to Elasticsearch

Original post: Structured Logging with rsyslog and Elasticsearch via @sematext

When your applications generate a lot of logs, you’d probably want to make some sense of them through searches and statistics. Here’s when structured logging comes in handy, and I would like to share some thoughts and configuration examples of how you could use a popular syslog daemon like rsyslog to handle both structured and unstructured logs. Then I’ll show you how to:

  • take a JSON from a syslog message and index it in Elasticsearch (which eats JSON documents)
  • append other syslog properties (like the date) to the existing JSON to make a bigger JSON document that would be indexed in Elasticsearch. This is how we set up rsyslog to handle CEE-formatted messages in our log analytics tool, Logsene

On structured logging

If we take an unstructured log message, like:

Joe bought 2 apples

And compare it with a similar one in JSON, like:

{“name”: “Joe”, “action”: “bought”, “item”: “apples”, “quantity”: 2}

We can immediately spot a good and a bad point of structured logging: if we index these logs, it will be faster and more precise to search for “apples” in the “item” field, rather than in the whole document. At the same time, the structured log will take up more space than the unstructured one.

But in most use-cases there will be more applications that would log the same subset of fields. So if you want to search for the same user across those applications, it’s nice to be able to pinpoint the “name” field everywhere. And when you add statistics, like who’s the user buying most of our apples, that’s when structured logging really becomes useful.

Finally, it helps to have a structure when it comes to maintenance. If a new version of the application adds a new field, and your log becomes:

Joe bought 2 red apples

it might break some log-parsing, while structured logs rarely suffer from the same problem.

Enter CEE and Lumberjack: structured logging with syslog

With syslog, as defined by RFC3164, there is already a structure in the sense that there’s a priority value (severity*8 + facility), a header (timestamp and hostname) and a message. But this usually isn’t the structure we’re looking for.

CEE and Lumberjack are efforts to introduce structured logging to syslog in a backwards-compatible way. The process is quite simple: in the message part of the log, one would start with a cookie string “@cee:”, followed by an optional space and then a JSON or XML. From this point on I will talk about JSON, since it’s the format that both rsyslog and Elasticsearch prefer. Here’s a sample CEE-enhanced syslog message:

@cee: {“foo”: “bar”}

This makes it quite easy to use CEE-enhanced syslog with existing syslog libraries, although there are specific libraries like liblumberlog, which make it even easier. They’ve also defined a list of standard fields, and applications should use those fields where they’re applicable – so that you get the same field names for all applications. But the schema is free, so you can add custom fields at will.

CEE-enhanced syslog with rsyslog

rsyslog has a module named mmjsonparse for handling CEE-enhanced syslog messages. It checks for the “CEE cookie” at the beginning of the message, and then tries to parse the following JSON. If all is well, the fields from that JSON are loaded and you can then use them in templates to extract whatever information seems important. Fields from your JSON can be accessed like this: $!field-name. An example of how they can be used is shown here.

To get started, you need to have at least rsyslog version 6.6.0, and I’d recommend using version 7 or higher. If you don’t already have that, check out the repositories for RHEL/CentOS and Ubuntu.

Also, mmjsonparse is not enabled by default. If you use the repositories, install the rsyslog-mmjsonparse package. If you compile rsyslog from sources, specify –enable-mmjsonparse when you run the configure script. In order for that to work you’d probably have to install libjson and liblognorm first, depending on your operating system.

For a proof of concept, we can take this config:

#load needed modules
module(load="imuxsock") # provides support for local system logging
module(load="imklog") # provides kernel logging support
module(load="mmjsonparse") #for parsing CEE-enhanced syslog messages

#try to parse structured logs
*.* :mmjsonparse:

#define a template to print field "foo"
template(name="justFoo" type="list") {
  property(name="$!foo")
  constant(value="\n") #we'll separate logs with a newline
}

#and now let's write the contents of field "foo" in a file
*.* action(type="omfile"
           template="justFoo"
           file="/var/log/foo")

To see things, better, you can start rsyslog in foreground and in debug mode:

rsyslogd -dn

And in another terminal, you can send a structured log, then see the value in your file:

# logger ‘@cee: {“foo”:”bar”}’
# cat /var/log/foo
bar

If we send an unstructured log, or an invalid JSON, nothing will be added

# logger ‘test’
# logger ‘@cee: test2’
# cat /var/log/foo
bar

But you can see in the debug output of rsyslog why:

mmjsonparse: no JSON cookie: ‘test’
[…]
mmjsonparse: toParse: ‘ test2’
mmjsonparse: Error parsing JSON ‘ test2’: boolean expected

Indexing logs in Elasticsearch

To index our logs in Elasticsearch, we will use an output module of rsyslog called omelasticsearch. Like mmjsonparse, it’s not compiled by default, so you will have to add the –enable-elasticsearch parameter to the configure script to get it built when you run make. If you use the repositories, you can simply install the rsyslog-elasticsearch package.

omelasticsearch expects a valid JSON from your template, to send it via HTTP to Elasticsearch. You can select individual fields, like we did in the previous scenario, but you can also select the JSON part of the message via the $!all-json property. That would produce the message part of the log, without the “CEE cookie”.

The configuration below should be good for inserting the syslog message to an Elasticsearch instance running on localhost:9200, under the index “system” and type “events“.

#load needed modules
module(load="imuxsock") # provides support for local system logging
module(load="imklog") # provides kernel logging support
module(load="mmjsonparse") #for parsing CEE-enhanced syslog messages
module(load="omelasticsearch") #for indexing to Elasticsearch

#try to parse a structured log
*.* :mmjsonparse:

#define a template to print all fields of the message
template(name="messageToES" type="list") {
  property(name="$!all-json")
}

#write the JSON message to the local ES node
*.* action(type="omelasticsearch"
           template="messageToES")

After restarting rsyslog, you can see your JSON will be indexed:

# logger ‘@cee: {“foo”: “bar”, “foo2”: “bar2″}’
# curl -XPOST localhost:9200/system/events/_search?q=foo2:bar2 2>/dev/null | sed s/.*_source//
” : { “foo”: “bar”, “foo2”: “bar2” }}]}}

As for unstructured logs, $!all-json will produce a JSON with a field named “msg”, having the message as a value:

# logger test
# curl -XPOST localhost:9200/system/events/_search?q=test 2>/dev/null | sed s/.*_source//
” : { “msg”: “test” }}]}}

It’s “msg” because that’s rsyslog’s property name for the syslog message.

Including other properties

But the message isn’t the only interesting property. I would assume most would want to index other information, like the timestamp, severity, or host which generated that message.

To do that, one needs to play with templates and properties. In the future it might be made easier, but at the time of this writing (rsyslog 7.2.3), you need to manually craft a valid JSON to pass it to omelasticsearch. For example, if we want to add the timestamp and the syslogtag, a working template might look like this:

template(name="customTemplate"
   type="list") {
#- open the curly brackets,
#- add the timestamp field surrounded with quotes
#- add the colon which separates field from value
#- open the quotes for the timestamp itself
   constant(value="{\"timestamp\":\"")
#- add the timestamp from the log,
# format it in RFC-3339, so that ES detects it by default
   property(name="timereported" dateFormat="rfc3339")
#- close the quotes for timestamp,
#- add a comma, then the syslogtag field in the same manner
   constant(value="\",\"syslogtag\":\"")
#- now the syslogtag field itself
# and format="json" will ensure special characters
# are escaped so they won't break our JSON
   property(name="syslogtag" format="json")
#- close the quotes for syslogtag
#- add a comma
#- then add our JSON-formatted syslog message,
# but start from the 2nd position to omit the left
# curly bracket
   constant(value="\",")
   property(name="$!all-json" position.from="2")
}

Summary

If you’re interested in searching or analyzing lots of logs, structured logging might help. And you can do it with the existing syslog libraries, via CEE-enhanced syslog. If you use a newer version of rsyslog, you can parse these logs with mmjsonparse and index them in Elasticsearch with omelasticsearch.  If you are interested in indexing/searching logs in general, check out other Sematext logging posts or follow @sematext.

Changelog for 6.5.1 (v6-beta)

Version 6.5.1 [BETA] 2012-10-11

  • added tool “logctl” to handle lumberjack logs in MongoDB
  • imfile ported to new v6 config interface
  • imfile now supports config parameter for maximum number of submits
    which is a fine-tuning parameter in regard to input baching
  • added pure JSON output plugin parameter passing mode
  • ommongodb now supports templates
  • bugfix: imtcp could abort on exit due to invalid free()
  • bugfix: remove invalid socket option call from imuxsock
    Thanks to Cristian Ionescu-Idbohrn and Jonny Törnbom
  • bugfix: missing support for escape sequences in RainerScript
    only \’ was supported. Now the usual set is supported. Note that v5
    used \x as escape where x was any character (e.g. “\n” meant “n” and NOT
    LF). This also means there is some incompatibility to v5 for well-know
    sequences. Better break it now than later.
  • bugfix: small memory leaks in template() statements
    these were one-time memory leaks during startup, so they did NOT grow
    during runtime
  • bugfix: config validation run did not always return correct return state
  • bugfix: config errors did not always cause statement to fail
    This could lead to startup with invalid parameters.

rsyslog 6.5.1 (v6-beta) released

This is the new v6-beta, which includes the full v6-subset of the new config language as well as somewhat improved support for lumberjack/CEE. This version concludes development efforts for v6.

Note that it is recommended to use v7 if you do not have any special need for v6.

ChangeLog:

http://www.rsyslog.com/changelog-for-6-5-1-v6-beta/

Download:

http://www.rsyslog.com/rsyslog-6-5-1-beta/

As always, feedback is appreciated.

Best regards,
Tim Eifler

Scroll to top