Monitoring rsyslog’s impstats with Kibana and SPM
Original post: Monitoring rsyslog with Kibana and SPM by @Sematext
A while ago we published this post where we explained how you can get stats about rsyslog, such as the number of messages enqueued, the number of output errors and so on. The point was to send them to Elasticsearch (or Logsene, our logging SaaS, which exposes the Elasticsearch API) in order to analyze them.
This is part 2 of that story, where we share how we process these stats in production. We’ll cover:
- an updated config, working with Elasticsearch 2.x
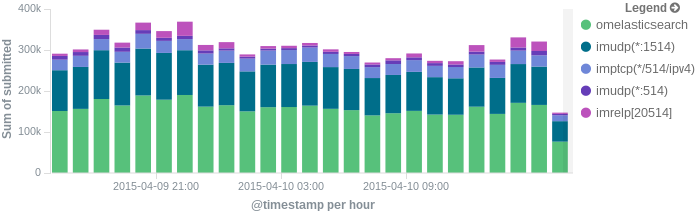
- what Kibana dashboards we have in Logsene to get an overview of what rsyslog is doing
- how we send some of these metrics to SPM as well, in order to set up alerts on their values: both threshold-based alerts and anomaly detection
Continue reading “Monitoring rsyslog’s impstats with Kibana and SPM”
Changelog for 8.16.0 (v8-stable)
——————————————————————————
Version 8.16.0 [v8-stable] 2016-01-26
- rsgtutil: Added extraction support including loglines and hash chains.
More details on how to extract loglines can be found in the rsgtutil
manpage. See also: https://github.com/rsyslog/rsyslog/issues/561 - clean up doAction output module interface
We started with char * pointers, but used different types of pointers
over time. This lead to alignment warnings. In practice, I think this
should never cause any problems (at least there have been no reports
in the 7 or so years we do this), but it is not clean. The interface is
now cleaned up. We do this in a way that does not require modifications
to modules that just use string parameters. For those with message
parameters, have a look at e.g. mmutf8fix to see how easy the
required change is. - new system properties for $NOW properties based on UTC
This permits to express current system time in UTC.
See also https://github.com/rsyslog/rsyslog/issues/729 - impstats: support broken ElasticSearch JSON implementation
ES 2.0 no longer supports valid JSON and disallows dots inside names.
This adds a new “json-elasticsearch” format option which replaces
those dots by the bang (“!”) character. So “discarded.full” becomes
“discarded!full”.
This is a workaroud. A method that will provide more control over
replacements will be implemented some time in the future. For
details, see below-quoted issue tracker.
closes https://github.com/rsyslog/rsyslog/issues/713 - omelasticsearch: craft better URLs
Elasticsearch is confused by url’s ending in a bare ‘?’ or ‘&’. While
this is valid, those are no longer produced.
Thanks to Benno Evers for the patch. - imfile: add experimental “reopenOnTruncate” parameter
Thanks to Matthew Wang for the patch. - bugfix imfile: proper handling of inotify initialization failure
Thanks to Zachary Zhao for the patch. - bugfix imfile: potential segfault due to improper handling of ev var
This occurs in inotify mode, only.
Thanks to Zachary Zhao and Peter Portante for the patch.
closes https://github.com/rsyslog/rsyslog/issues/718 - bugfix imfile: potential segfault under heavey load.
This occurs in inotify mode when using wildcards, only.
The root cause is dropped IN_IGNOPRED inotify events which be dropped
in circumstance of high input pressure and frequent rotation, and
according to wikipeida, they can also be dropped in other conditions.
Thanks to Zachary Zhao for the patch.
closes https://github.com/rsyslog/rsyslog/issues/723 - bugfix ommail: invalid handling of server response
if that response was split into different read calls. Could lead to
error-termination of send operation. Problem is pretty unlikely to
occur in standard setups (requires slow connection to SMTP server).
Thank to github user haixingood for the patch. - bugfix omelasticsearch: custom serverport was ignored on some platforms
Thanks to Benno Evers for the patch. - bugfix: tarball did not include some testbench files
Thanks to Thomas D. (whissi) for the patch. - bugfix: memory misadressing during config parsing string template
This occurred if an (invalid) template option larger than 63 characters
was given.
Thanks to git hub user c6226 for the patch. - bugfix imzmq: memory leak
Thanks to Jeremy Liang for the patch. - bugfix imzmq: memory leak
Thanks to github user xushengping for the patch. - bugfix omzmq: memory leak
Thanks to Jack Lin for the patch. - some code improvement and cleanup
Tutorial: Sending impstats Metrics to Elasticsearch Using Rulesets and Queues
Originally posted on the Sematext blog: Monitoring rsyslog’s Performance with impstats and Elasticsearch
If you’re using rsyslog for processing lots of logs (and, as we’ve shown before, rsyslog is good at processing lots of logs), you’re probably interested in monitoring it. To do that, you can use impstats, which comes from input module for process stats. impstats produces information like:
– input stats, like how many events went through each input
– queue stats, like the maximum size of a queue
– action (output or message modification) stats, like how many events were forwarded by each action
– general stats, like CPU time or memory usage
In this post, we’ll show you how to send those stats to Elasticsearch (or Logsene — essentially hosted ELK, our log analytics service, that exposes the Elasticsearch API), where you can explore them with a nice UI, like Kibana. For example get the number of logs going through each input/output per hour:
More precisely, we’ll look at:
– useful options around impstats
– how to use those stats and what they’re about
– how to ship stats to Elasticsearch/Logsene by using rsyslog’s Elasticsearch output
– how to do this shipping in a fast and reliable way. This will apply to most rsyslog use-cases, not only impstats
Continue reading “Tutorial: Sending impstats Metrics to Elasticsearch Using Rulesets and Queues”
rsyslog 7.6.0 (v7-stable) released
This is the first release of rsyslog 7.6 in the v7-stable branch. Since 7.4 a lot of new functions have found their way into rsyslog. With 7.6 being the successor of the 7.5 development branch, everything that has been added there has now found its way into the stable version. The major additions consist of
- imrelp/omrelp now support TLS & (zip) compression
- impstats is now emitting resource usage counters, can directly emit delta values and can now be bound to a ruleset
- mmpstrucdata is a new module to parse RFC5424 structured data into JSON message properties
- mmutf8fix is a new module to fix invalid UTF-8 sequences
- mmsequence is a new module that helps with action load balancing
- new defaults for main/ruleset queues to be more enterprise-like
Also the new stable version has undergone a lot of bug fixes, performance improvements and optimizations that make rsyslog 7.6 a lot more reliable and performing than before. Also, requirements have changed a little. For rsyslog 7.6 you now require librelp 1.1.4 and libestr 0.1.7 due to major fixes.
More detailed information is available in the ChangeLog.
ChangeLog: http://www.rsyslog.com/changelog-for-7-6-0-v7-stable/
Download: http://www.rsyslog.com/rsyslog-7-6-0-v7-stable/
As always, feedback is appreciated.
Best regards,
Florian Riedl
rsyslog 7.5.8 (v7-devel) released
Users are suggested to try out this versions and report errors. If we don’t learn of serious problems, we will most probably release 7.6.0 next week based on this code here.
More detailed information is available in the changelog.
ChangeLog:
http://www.rsyslog.com/changelog-for-7-5-8-v7-devel/
Download:
http://www.rsyslog.com/rsyslog-7-5-8-v7-devel/
As always, feedback is appreciated.
Best regards,
Florian Riedl
rsyslog 7.5.8 (v7-devel)
Download file name: rsyslog 7.5.8 (devel)
rsyslog 7.5.8 (devel)
sha256 hash: 38a8b5be53feaae9225e46f2c93d7c
Author: Rainer Gerhards (rgerhards@adiscon.com)
Version: 7.5.8 File
size: 2.595 MB
Changelog for 7.5.8 (v7-devel)
Version 7.5.8 [v7-release candidate] 2014-01-09
- add exec_template() RainerScript function
- add debug.onShutdown and debug.logFile global paramters
These enebale the new “debug on shutdown” mode, which can be used to track hard to find problems that occur during system shutdown. - Add directives for numerically specifying GIDs/UIDs
The already present directives (FileOwner, FileGroup, DirOwner, DirGroup) translate names to numerical IDs, which depends on the user information being available during rsyslog’s startup. This can fail if the information is obtained over a network or from a service such as SSSD. The new directives provide a way to specify the numerical IDs directly and bypass the lookup.
Thanks to Tomas Heinrich for the patch. - actions now report if they suspend and resume themselves
this is by default on and controllable by the action.reportSuspension global parameter - bugfix: omelasticsearch fail.es stats counter was improperly maintained
- bugfix: mmrfc5424addhmac: “key” parameter was not properly processed
- add new impstats action counters:
- * suspended
- * suspended.duration
- * resumed
rsyslog statistic counter plugin impstats
Plugin – impstats (rsyslog 7.5.3+) The impstats plugin gathers some internal statistics. They have different names depending on the actual statistics. Obviously, they do not relate to the plugin itself but rather to a broader object – most notably the rsyslog process itself. The “resource-usage” counter maintains process statistics. They base on the getrusage() system call. The counters are named like getrusage returned data memebers. So for details, looking them up in “man getrusage” is highly recommended, especially as value may be different depending on the platform. A getrusage() call is done immediately before the counter is emitted. The follwowing individual counters are maintained:
- utime – this is the user time in microseconds (thus the timeval structure combined)
- stime – again, time given in microseconds
- maxrss
- minflt
- majflt
- inblock
- oublock
- nvcsw
- nivcsw
How to use impstats
This summary was contributed by David Caplinger through the mailing list.
First, enable the module with something like:
module(load="impstats" interval="660" severity="7")
This will start generating logs tagged with “rsyslogd-pstats” every 600 seconds. If you like, you can use that tag to filter them into their own file:
if $syslogtag contains 'rsyslogd-pstats' then {
     action(type="omfile" queue.type="linkedlist" queue.discardmark="980"
            name="pstats" file="/var/log/pstats")
     stop
}
You’ll wind up with several log lines at each interval, all showing current counters (since rsyslog restart). So to determine inter-interval deltas, you’d have to import these into a spreadsheet. (Newer rsyslog can emit just the deltas in the log lines, but that’s in v7.5.x I believe.)
For example, if you want to filter based on some property (such as source IP address) and send the matching logs to both a local file and on to a remote destination, you might use something like:
if $fromhost-ip ==
     [ "1.1.1.1",
       "2.2.2.2" ]
then {
     action (type="omfwd" queue.type="linkedlist" queue.discardmark="980"
             action.resumeretrycount="-1" name="NET.forward" target="10.10.10.10"
             port="514" protocol="tcp")
     action (type="omfile" queue.type="linkedlist" queue.discardmark="980"
             name="NET.local" file="/var/log/messages")
     stop
}
Which is a log flow like:
source -> imudp -> main Q -> NET.local (to local files) & NET.forward (to remote)
Here’s an example of a batch of pstats output (re-ordered slightly) from the above config:
Nov 13 14:31:35 loghost rsyslogd-pstats: imudp(*:514): submitted=23035
Nov 13 14:31:35 loghost rsyslogd-pstats: main Q: size=15 enqueued=89624087 full=0 discarded.full=0 discarded.nf=0 maxqsize=444
Nov 13 14:31:35 loghost rsyslogd-pstats: NET.local: size=0 enqueued=11541 full=0 discarded.full=0 discarded.nf=0 maxqsize=7
Nov 13 14:31:35 loghost rsyslogd-pstats: NET.local: processed=11541 failed=0
Nov 13 14:31:35 loghost rsyslogd-pstats: NET.forward: size=0 enqueued=11541 full=0 discarded.full=0 discarded.nf=0 maxqsize=7
Nov 13 14:31:35 loghost rsyslogd-pstats: NET.forward: processed=11541 failed=0
Nov 13 14:31:35 loghost rsyslogd-pstats: pstats: size=0 enqueued=65508 full=0 discarded.full=0 discarded.nf=0 maxqsize=25
Nov 13 14:31:35 loghost rsyslogd-pstats: pstats: processed=65500 failed=0
In this case we have:
1) A UDP input (imudp)
This logs message counts “submitted” to rsyslog via UDP port 514.
2) A main queue (main Q)
This shows messages entering the queue (enqueued), as well as any dropped messages (discarded.full=0, discarded.nf=0). It also shows how many times the queue has become completely full (full=0) and it keeps a running total of the maximum size the queue has ever hit (maxqsize=444). (All these counters are since rsyslog startup.)
3) Two output/action queues (NET.local, NET.forward)
These logs queue stats like above, as well as successfully “processed” (via omfile and omfwd in this case), indicating successful delivery to their final destination (local file or remote TCP receiver, in this case).
4) Another queue to handle pstats output itself (as I described above)
This example doesn’t happen to include DA-mode, which adds another pstats log line for the DA portion of the associated action queue.
If you don’t give your action queues names, you’ll wind up with pstats logs referring to things like “action 2”, and have a hard time figuring out what is going on.
A well-behaved queue will have zero discarded.full and discarded.nf, and a low maxqsize, meaning that everything entering the queue is leaving promptly. In a backlog situation, you’ll see size and maxqsize for an action/output queue increase over time, until maxqsize hits your configured queue.size parameter. Then the main Q will start increasing in size (and maxqsize) until it approaches and exceeds full. Then the discarded.nf and discarded.full counters will start climbing.
impstats delayed or lost? – cause and cure
Some users report that they do not receive all impstats log records or that these log records are delayed. The common thing about these questions is that those user tend to have very large main message queues.
By default, impstats is run in-band, which means that it’s messages are submitted to the main message queue just like any other messages are. So if the main queue takes very long to processs, impstats messages get delayed as well. They may be discarded, too, based on queue settings and queue full status. In this scenarios, impstats obviously has problems reporting what is going on.
A simple solution is to run impstats off-band. This is done by simply instructing it to directly write to file. In that mode, the rsyslog engine is not used at all, and output will always be available and happen right on the interval. There is a drawback, though: as the rsyslog core engine is not involved, things like dynafiles, different templates or forwarding to another host are not possible.
Note that impstats can submit messages both to a file and the regular message stream. This may be an interesting alternative if the main queue causes trouble but usually logs shall be gathered at some central place.
Example for writing to a local file:
module(load="impstats" interval="600" severity="7" log.file="/var/log/impstats")