Monitoring rsyslog’s impstats with Kibana and SPM
Original post: Monitoring rsyslog with Kibana and SPM by @Sematext
A while ago we published this post where we explained how you can get stats about rsyslog, such as the number of messages enqueued, the number of output errors and so on. The point was to send them to Elasticsearch (or Logsene, our logging SaaS, which exposes the Elasticsearch API) in order to analyze them.
This is part 2 of that story, where we share how we process these stats in production. We’ll cover:
- an updated config, working with Elasticsearch 2.x
- what Kibana dashboards we have in Logsene to get an overview of what rsyslog is doing
- how we send some of these metrics to SPM as well, in order to set up alerts on their values: both threshold-based alerts and anomaly detection
Updated config
Here’s how our config looks like for pushing rsyslog stats to Elasticsearch:
  module(load="impstats"
    interval="10"
    resetCounters="on"
    format="json-elasticsearch"
    ruleset="stats")

  template(name="rsyslog_stats" type="list") {
    constant(value="{")
    constant(value="\"@timestamp\":\"")
    property(name="timereported" dateFormat="rfc3339")
    constant(value="\",\"host\":\"")
    property(name="hostname")
    constant(value="\",")
    property(name="$!all-json" position.from="2")
  }

  ruleset(name="stats"){
    action(
      name="parse_rsyslog_stats"
      type="mmnormalize"
      ruleBase="/etc/rsyslog-json.rulebase" # contains just: rule=:%data:json%)

    action(
      name="push_rsyslog_stats"
      type="omelasticsearch"
      server="logsene-receiver.sematext.com"
      serverport="80"
      template="rsyslog_stats"
      searchIndex="LOGSENE-APP-TOKEN-GOES-HERE"
      bulkmode="on"
      action.resumeRetryCount="3"
      action.resumeInterval="60")
  }
It looks similar to the one in the previous post, but let’s quickly go over it:
- first, we load the impstats module, which pushes metrics to the stats ruleset every 10 seconds, in JSON. To work with Elasticsearch 2.x, any dots in the field names are replaced with exclamation points
- then we have a template which defines how the final Elasticsearch JSON documents will look like. They will contain the timestamp, the host name and all the fields from the JSON generated by impstats
- finally, there’s the stats ruleset, which processes logs independently of other flows in rsyslog (each ruleset has its own threads and queues). Within this ruleset we have two actions:
- first action uses mmnormalize to parse the JSONs generated by impstats
- second one sends the final JSON documents to Elasticsearch/Logsene, as defined by the template
Kibana dashboard
The whole point of parsing all these stats is to be able to dig into them. Kibana visualizations offer a nice way to get quick insights on structured data, and you can see our main dashboard below. Logsene offers it out of the box, so monitoring rsyslog is a good opportunity to eat our own dog food.
Now let’s see what each visualization does and how to build it.
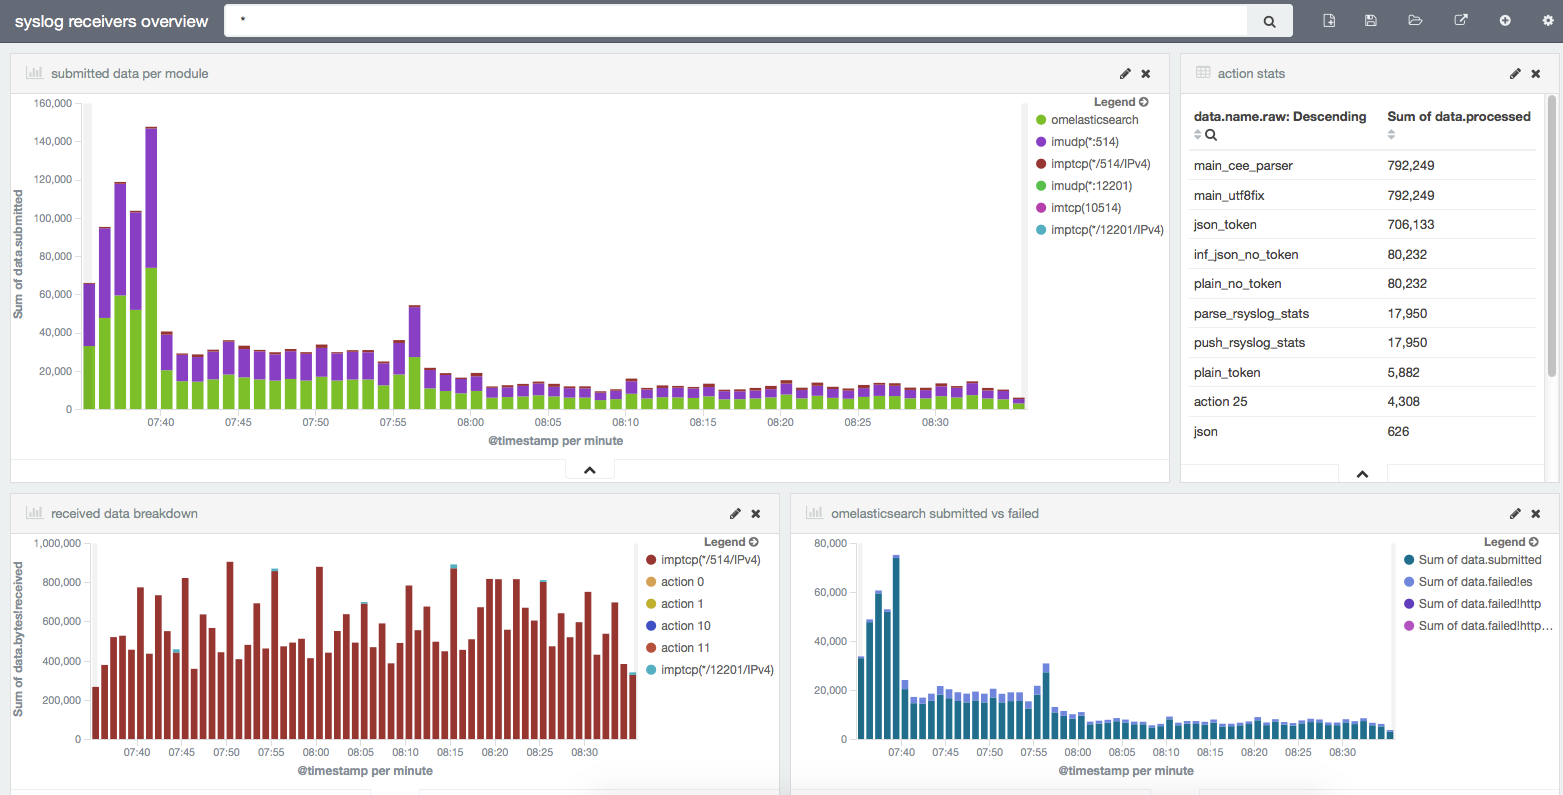
Submitted data per module
This shows how many messages went through each module. In the case of input modules like imptcp, you’ll have separate stats for each defined input (e.g. on different ports).
This graph is built on top of a date histogram on timestamp. Bars are splitted via a terms aggregation on the data.name.raw field (which shows the module/input name). The Y axis shows the sum on the data.submitted field, which shows how many messages each module submits: to the main queue, in the case of inputs, and to the destination (here, Elasticsearch) in the case of outputs.
Action stats
This is a table that shows totals on the number of messages processed by each action. This is where naming actions becomes useful: that “action 25” doesn’t help a lot, but name=”push_rsyslog_stats” like in the above configuration snippet does. To build the table, you’d do the same terms aggregation on data.name.raw, but now the metric would be the sum of data.processed.
Received data breakdown
This is a lot like “Submitted data per module”, except that the Y axis is now in bytes, not messages, as described by the data.bytes!received field.
omelasticsearch submitted vs failed
Yet another histogram, but this one is linked to a saved search on data.name:omelasticsearch to give us more details on the Elasticsearch output, which we use heavily. We don’t break the chart by any terms aggregation, instead we use multiple metrics on the Y axis: data.submitted for the total number of messages sent, and then data.failed!es, data.failed!http and data.failed!httprequests for the number of messages encountering errors.
“es” means there was an error from Elasticsearch (like a mapping error), in which case the message is dropped (you can use an error file to write this data down). HTTP errors are retried according to the action.resumeRetryCount and action.resumeInterval settings. resumeRetryCount can be set to -1 to make rsyslog retry indefinitely.
We’re interested in knowing if there’s a spike of failed messages, compared to the amount of data being sent. Which leads me to the next topic: how do you alert on those metrics?
For now, Logsene can alert on the number of logs matching a query, but not on metrics from these logs. This will be added in a future release but in the meantime, we make use of SPM – which was designed from the ground up to handle metrics – to poke us when something is wrong.
Pushing metrics to SPM
To push rsyslog’s metrics to SPM we can’t use omelasticsearch, because SPM doesn’t expose the Elasticsearch API. Yet. So we had to build an rsyslog output plugin for SPM, and we did so using the external interface. It will be included in rsyslog 8.18, but you can download and use the plugin today: https://raw.githubusercontent.com/sematext/rsyslog/f21c8b9b47c5a41ea1768117229787bf8f0b47ca/plugins/external/spm/rsyslog_spm_custom_metrics.py
You just need to fill in the SPM application token in the spmToken variable, then all the interesting bits happen back in rsyslog.conf: a template and an action within the stats ruleset.
SPM template
The template allows you to select which metrics you want to send and how to aggregate them. Here, we make SPM record the sum of messages submitted per input/action, where each of those inputs/actions comes up as a separate metric:
template(name="stats_spm" type="list" option.json="on") {
  constant(value="{")
  constant(value="\"name\":\"")
  property(name="$!data!name")
  constant(value="\",\"value\":")
  property(name="$!data!submitted")
  constant(value=",\"aggregation\":\"sum\"}\n")
}
omprog action
Finally, in the stats ruleset, we call the external script for all impstats-generated messages containing those properties. The action will use the external program outputmodule and specify the stats_spm template defined earlier:
if ($!data!submitted != "") and ($!data!name != "") then {
  action(
    type="omprog"
    binary="/opt/rsyslog/rsyslog_spm_custom_metrics.py"
    template="stats_spm"
  )
}
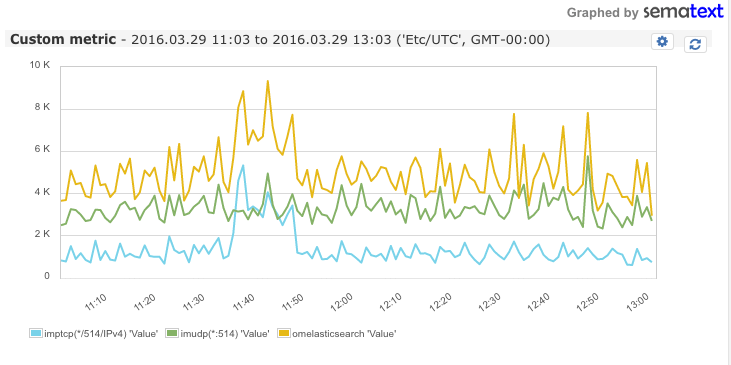
After restarting rsyslog, you should start seeing rsyslog metrics in the Custom Metrics tab of the selected SPM application:
Setting up alerts
Now that we have metrics in SPM, we can set up alerts. To do that, you’d select the metric name on the right (though you can also alert on aggregate counts) then click on the cogwheel icon and select Create Alert. For example, we’ve set up anomaly detection on the number of submitted messages through omelasticsearch:
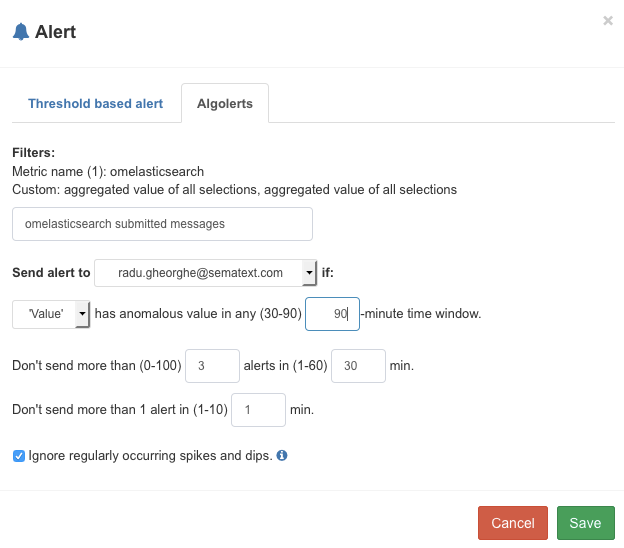
Now we get Emails when these numbers are too high and too low, also taking into account the normal spikes and dips (e.g. at different times of the day) or increases in traffic (as Logsene keeps getting more users).
You can use the rsyslog->SPM combo for more than monitoring rsyslog itself. You can submit any metrics – for example, application metrics – that you can parse from logs with rsyslog – typically via mmnormalize like we did here.