rsyslog 8.21.0 (v8-stable) released
We have released rsyslog 8.21.0.
This release is mostly for maintenance. There was a big change to how internal messages are handled. These are no longer logged via the internal bridge, but via the syslog() API call. For regular users, this should make not too much difference.
Additionaly, the TLS syslog error messages have been improved, as well as the robustness of the queue subsystem.
https://github.com/rsyslog/rsyslog/blob/v8-stable/ChangeLog
Download:
http://www.rsyslog.com/downloads/download-v8-stable/
As always, feedback is appreciated.
Best regards,
Florian Riedl
Connecting with Logstash via Apache Kafka
Original post: Recipe: rsyslog + Kafka + Logstash by @Sematext
This recipe is similar to the previous rsyslog + Redis + Logstash one, except that we’ll use Kafka as a central buffer and connecting point instead of Redis. You’ll have more of the same advantages:
- rsyslog is light and crazy-fast, including when you want it to tail files and parse unstructured data (see the Apache logs + rsyslog + Elasticsearch recipe)
- Kafka is awesome at buffering things
- Logstash can transform your logs and connect them to N destinations with unmatched ease
There are a couple of differences to the Redis recipe, though:
- rsyslog already has Kafka output packages, so it’s easier to set up
- Kafka has a different set of features than Redis (trying to avoid flame wars here) when it comes to queues and scaling
As with the other recipes, I’ll show you how to install and configure the needed components. The end result would be that local syslog (and tailed files, if you want to tail them) will end up in Elasticsearch, or a logging SaaS like Logsene (which exposes the Elasticsearch API for both indexing and searching). Of course you can choose to change your rsyslog configuration to parse logs as well (as we’ve shown before), and change Logstash to do other things (like adding GeoIP info).
Getting the ingredients
First of all, you’ll probably need to update rsyslog. Most distros come with ancient versions and don’t have the plugins you need. From the official packages you can install:
- rsyslog. This will update the base package, including the file-tailing module
- rsyslog-kafka. This will get you the Kafka output module
If you don’t have Kafka already, you can set it up by downloading the binary tar. And then you can follow the quickstart guide. Basically you’ll have to start Zookeeper first (assuming you don’t have one already that you’d want to re-use):
bin/zookeeper-server-start.sh config/zookeeper.properties
And then start Kafka itself and create a simple 1-partition topic that we’ll use for pushing logs from rsyslog to Logstash. Let’s call it rsyslog_logstash:
bin/kafka-server-start.sh config/server.properties
bin/kafka-topics.sh --create --zookeeper localhost:2181 --replication-factor 1 --partitions 1 --topic rsyslog_logstash
Finally, you’ll have Logstash. At the time of writing this, we have a beta of 2.0, which comes with lots of improvements (including huge performance gains of the GeoIP filter I touched on earlier). After downloading and unpacking, you can start it via:
bin/logstash -f logstash.conf
Though you also have packages, in which case you’d put the configuration file in /etc/logstash/conf.d/ and start it with the init script.
Configuring rsyslog
With rsyslog, you’d need to load the needed modules first:
module(load="imuxsock")  # will listen to your local syslog
module(load="imfile")    # if you want to tail files
module(load="omkafka")   # lets you send to Kafka
If you want to tail files, you’d have to add definitions for each group of files like this:
input(type="imfile"
  File="/opt/logs/example*.log"
  Tag="examplelogs"
)
Then you’d need a template that will build JSON documents out of your logs. You would publish these JSON’s to Kafka and consume them with Logstash. Here’s one that works well for plain syslog and tailed files that aren’t parsed via mmnormalize:
template(name="json_lines" type="list" option.json="on") {
  constant(value="{")
  constant(value="\"timestamp\":\"")
  property(name="timereported" dateFormat="rfc3339")
  constant(value="\",\"message\":\"")
  property(name="msg")
  constant(value="\",\"host\":\"")
  property(name="hostname")
  constant(value="\",\"severity\":\"")
  property(name="syslogseverity-text")
  constant(value="\",\"facility\":\"")
  property(name="syslogfacility-text")
  constant(value="\",\"syslog-tag\":\"")
  property(name="syslogtag")
  constant(value="\"}")
}
By default, rsyslog has a memory queue of 10K messages and has a single thread that works with batches of up to 16 messages (you can find all queue parameters here). You may want to change:
– the batch size, which also controls the maximum number of messages to be sent to Kafka at once
– the number of threads, which would parallelize sending to Kafka as well
– the size of the queue and its nature: in-memory(default), disk or disk-assisted
In a rsyslog->Kafka->Logstash setup I assume you want to keep rsyslog light, so these numbers would be small, like:
main_queue(
  queue.workerthreads="1"      # threads to work on the queue
  queue.dequeueBatchSize="100" # max number of messages to process at once
  queue.size="10000"           # max queue size
)
Finally, to publish to Kafka you’d mainly specify the brokers to connect to (in this example we have one listening to localhost:9092) and the name of the topic we just created:
action(
  broker=["localhost:9092"]
  type="omkafka"
  topic="rsyslog_logstash"
  template="json"
)
Assuming Kafka is started, rsyslog will keep pushing to it.
Configuring Logstash
This is the part where we pick the JSON logs (as defined in the earlier template) and forward them to the preferred destinations. First, we have the input, which will use to the Kafka topic we created. To connect, we’ll point Logstash to Zookeeper, and it will fetch all the info about Kafka from there:
input {
  kafka {
    zk_connect => "localhost:2181"
    topic_id => "rsyslog_logstash"
  }
}
At this point, you may want to use various filters to change your logs before pushing to Logsene/Elasticsearch. For this last step, you’d use the Elasticsearch output:
output {
  elasticsearch {
    hosts => "localhost" # it used to be "host" pre-2.0
    port => 9200
    #ssl => "true"
    #protocol => "http" # removed in 2.0
  }
}
And that’s it! Now you can use Kibana (or, in the case of Logsene, either Kibana or Logsene’s own UI) to search your logs!
Recipe: Apache Logs + rsyslog (parsing) + Elasticsearch
Original post: Recipe: Apache Logs + rsyslog (parsing) + Elasticsearch by @Sematext
This recipe is about tailing Apache HTTPD logs with rsyslog, parsing them into structured JSON documents, and forwarding them to Elasticsearch (or a log analytics SaaS, like Logsene, which exposes the Elasticsearch API). Having them indexed in a structured way will allow you to do better analytics with tools like Kibana:

We’ll also cover pushing logs coming from the syslog socket and kernel, and how to buffer all of them properly. So this is quite a complete recipe for your centralized logging needs.
Getting the ingredients
Even though most distros already have rsyslog installed, it’s highly recommended to get the latest stable from the rsyslog repositories. The packages you’ll need are:
- rsyslog. The base package, including the file-tailing module (imfile)
- rsyslog-mmnormalize. This gives you mmnormalize, a module that will do the parsing of common Apache logs to JSON
- rsyslog-elasticsearch, for the Elasticsearch output
With the ingredients in place, let’s start cooking a configuration. The configuration needs to do the following:
- load the required modules
- configure inputs: tailing Apache logs and system logs
- configure the main queue to buffer your messages. This is also the place to define the number of worker threads and batch sizes (which will also be Elasticsearch bulk sizes)
- parse common Apache logs into JSON
- define a template where you’d specify how JSON messages would look like. You’d use this template to send logs to Logsene/Elasticsearch via the Elasticsearch output
Loading modules
Here, we’ll need imfile to tail files, mmnormalize to parse them, and omelasticsearch to send them. If you want to tail the system logs, you’d also need to include imuxsock and imklog (for kernel logs).
# system logs
module(load="imuxsock")
module(load="imklog")
# file
module(load="imfile")
# parser
module(load="mmnormalize")
# sender
module(load="omelasticsearch")
Configure inputs
For system logs, you typically don’t need any special configuration (unless you want to listen to a non-default Unix Socket). For Apache logs, you’d point to the file(s) you want to monitor. You can use wildcards for file names as well. You also need to specify a syslog tag for each input. You can use this tag later for filtering.
input(type="imfile"
      File="/var/log/apache*.log"
      Tag="apache:"
)NOTE: By default, rsyslog will not poll for file changes every N seconds. Instead, it will rely on the kernel (via inotify) to poke it when files get changed. This makes the process quite realtime and scales well, especially if you have many files changing rarely. Inotify is also less prone to bugs when it comes to file rotation and other events that would otherwise happen between two “polls”. You can still use the legacy mode=”polling” by specifying it in imfile’s module parameters.
Queue and workers
By default, all incoming messages go into a main queue. You can also separate flows (e.g. files and system logs) by using different rulesets but let’s keep it simple for now.
For tailing files, this kind of queue would work well:
main_queue(
  queue.workerThreads="4"
  queue.dequeueBatchSize="1000"
  queue.size="10000"
)
This would be a small in-memory queue of 10K messages, which works well if Elasticsearch goes down, because the data is still in the file and rsyslog can stop tailing when the queue becomes full, and then resume tailing. 4 worker threads will pick batches of up to 1000 messages from the queue, parse them (see below) and send the resulting JSONs to Elasticsearch.
If you need a larger queue (e.g. if you have lots of system logs and want to make sure they’re not lost), I would recommend using a disk-assisted memory queue, that will spill to disk whenever it uses too much memory:
main_queue(
  queue.workerThreads="4"
  queue.dequeueBatchSize="1000"
  queue.highWatermark="500000"    # max no. of events to hold in memory
  queue.lowWatermark="200000"     # use memory queue again, when it's back to this level
  queue.spoolDirectory="/var/run/rsyslog/queues"  # where to write on disk
  queue.fileName="stats_ruleset"
  queue.maxDiskSpace="5g"        # it will stop at this much disk space
  queue.size="5000000"           # or this many messages
  queue.saveOnShutdown="on"      # save memory queue contents to disk when rsyslog is exiting
)
Parsing with mmnormalize
The message normalization module uses liblognorm to do the parsing. So in the configuration you’d simply point rsyslog to the liblognorm rulebase:
action(type="mmnormalize"
  rulebase="/opt/rsyslog/apache.rb"
)
where apache.rb will contain rules for parsing apache logs, that can look like this:
version=2

rule=:%clientip:word% %ident:word% %auth:word% [%timestamp:char-to:]%] "%verb:word% %request:word% HTTP/%httpversion:float%" %response:number% %bytes:number% "%referrer:char-to:"%" "%agent:char-to:"%"%blob:rest%
Where version=2 indicates that rsyslog should use liblognorm’s v2 engine (which is was introduced in rsyslog 8.13) and then you have the actual rule for parsing logs. You can find more details about configuring those rules in the liblognorm documentation.
Besides parsing Apache logs, creating new rules typically requires a lot of trial and error. To check your rules without messing with rsyslog, you can use the lognormalizer binary like:
head -1 /path/to/log.file | /usr/lib/lognorm/lognormalizer -r /path/to/rulebase.rb -e json
NOTE: If you’re used to Logstash’s grok, this kind of parsing rules will look very familiar. However, things are quite different under the hood. Grok is a nice abstraction over regular expressions, while liblognorm builds parse trees out of specialized parsers. This makes liblognorm much faster, especially as you add more rules. In fact, it scales so well, that for all practical purposes, performance depends on the length of the log lines and not on the number of rules. This post explains the theory behind this assuption, and this is actually proven by various tests. The downside is that you’ll lose some of the flexibility offered by regular expressions. You can still use regular expressions with liblognorm (you’d need to set allow_regex to on when loading mmnormalize) but then you’d lose a lot of the benefits that come with the parse tree approach.
Template for parsed logs
Since we want to push logs to Elasticsearch as JSON, we’d need to use templates to format them. For Apache logs, by the time parsing ended, you already have all the relevant fields in the $!all-json variable, that you’ll use as a template:
template(name="all-json" type="list"){
  property(name="$!all-json")
}
Template for time-based indices
For the logging use-case, you’d probably want to use time-based indices (e.g. if you keep your logs for 7 days, you can have one index per day). Such a design will give your cluster a lot more capacity due to the way Elasticsearch merges data in the background (you can learn the details in our presentations at GeeCON and Berlin Buzzwords).
To make rsyslog use daily or other time-based indices, you need to define a template that builds an index name off the timestamp of each log. This is one that names them logstash-YYYY.MM.DD, like Logstash does by default:
template(name="logstash-index"
  type="list") {
    constant(value="logstash-")
    property(name="timereported" dateFormat="rfc3339" position.from="1" position.to="4")
    constant(value=".")
    property(name="timereported" dateFormat="rfc3339" position.from="6" position.to="7")
    constant(value=".")
    property(name="timereported" dateFormat="rfc3339" position.from="9" position.to="10")
}
And then you’d use this template in the Elasticsearch output:
action(type="omelasticsearch"
  template="all-json"
  dynSearchIndex="on"
  searchIndex="logstash-index"
  searchType="apache"
  server="MY-ELASTICSEARCH-SERVER"
  bulkmode="on"
  action.resumeretrycount="-1"
)
Putting both Apache and system logs together
If you use the same rsyslog to parse system logs, mmnormalize won’t parse them (because they don’t match Apache’s common log format). In this case, you’ll need to pick the rsyslog properties you want and build an additional JSON template:
template(name="plain-syslog"
  type="list") {
    constant(value="{")
      constant(value="\"timestamp\":\"")     property(name="timereported" dateFormat="rfc3339")
      constant(value="\",\"host\":\"")        property(name="hostname")
      constant(value="\",\"severity\":\"")    property(name="syslogseverity-text")
      constant(value="\",\"facility\":\"")    property(name="syslogfacility-text")
      constant(value="\",\"tag\":\"")   property(name="syslogtag" format="json")
      constant(value="\",\"message\":\"")    property(name="msg" format="json")
    constant(value="\"}")
}
Then you can make rsyslog decide: if a log was parsed successfully, use the all-json template. If not, use the plain-syslog one:
if $parsesuccess == "OK" then {
 action(type="omelasticsearch"
  template="all-json"
  ...
 )
} else {
 action(type="omelasticsearch"
  template="plain-syslog"
  ...
 )
}
And that’s it! Now you can restart rsyslog and get both your system and Apache logs parsed, buffered and indexed into Elasticsearch. If you’re a Logsene user, the recipe is a bit simpler: you’d follow the same steps, except that you’ll skip the logstash-index template (Logsene does that for you) and your Elasticsearch actions will look like this:
action(type="omelasticsearch"
  template="all-json or plain-syslog"
  searchIndex="LOGSENE-APP-TOKEN-GOES-HERE"
  searchType="apache"
  server="logsene-receiver.sematext.com"
  serverport="80"
  bulkmode="on"
  action.resumeretrycount="-1"
)
Coupling with Logstash via Redis
Original post: Recipe: rsyslog + Redis + Logstash by @Sematext
OK, so you want to hook up rsyslog with Logstash. If you don’t remember why you want that, let me give you a few hints:
- Logstash can do lots of things, it’s easy to set up but tends to be too heavy to put on every server
- you have Redis already installed so you can use it as a centralized queue. If you don’t have it yet, it’s worth a try because it’s very light for this kind of workload.
- you have rsyslog on pretty much all your Linux boxes. It’s light and surprisingly capable, so why not make it push to Redis in order to hook it up with Logstash?
In this post, you’ll see how to install and configure the needed components so you can send your local syslog (or tail files with rsyslog) to be buffered in Redis so you can use Logstash to ship them to Elasticsearch, a logging SaaS like Logsene (which exposes the Elasticsearch API for both indexing and searching) so you can search and analyze them with Kibana:

Tutorial: Sending impstats Metrics to Elasticsearch Using Rulesets and Queues
Originally posted on the Sematext blog: Monitoring rsyslog’s Performance with impstats and Elasticsearch
If you’re using rsyslog for processing lots of logs (and, as we’ve shown before, rsyslog is good at processing lots of logs), you’re probably interested in monitoring it. To do that, you can use impstats, which comes from input module for process stats. impstats produces information like:
– input stats, like how many events went through each input
– queue stats, like the maximum size of a queue
– action (output or message modification) stats, like how many events were forwarded by each action
– general stats, like CPU time or memory usage
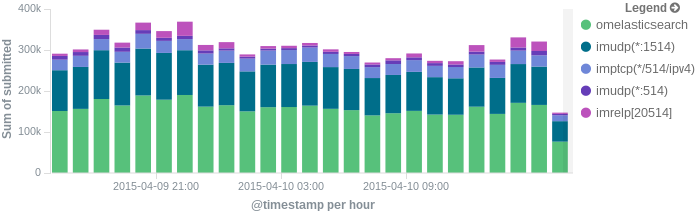
In this post, we’ll show you how to send those stats to Elasticsearch (or Logsene — essentially hosted ELK, our log analytics service, that exposes the Elasticsearch API), where you can explore them with a nice UI, like Kibana. For example get the number of logs going through each input/output per hour:
More precisely, we’ll look at:
– useful options around impstats
– how to use those stats and what they’re about
– how to ship stats to Elasticsearch/Logsene by using rsyslog’s Elasticsearch output
– how to do this shipping in a fast and reliable way. This will apply to most rsyslog use-cases, not only impstats
Continue reading “Tutorial: Sending impstats Metrics to Elasticsearch Using Rulesets and Queues”
Performance Tuning&Tests for the Elasticsearch Output
Original post: Rsyslog 8.1 Elasticsearch Output Performance by @Sematext
Version 8 brings major changes in rsyslog’s core – see Rainer’s presentation about it for more details. Those changes should give outputs better performance, and the Elasticsearch one should benefit a lot. Since we’re using rsyslog and Elasticsearch in Sematext‘s own log analytics product, Logsene, we had to take the new version for a spin.
The Weapon and the Target
For testing, we used a good-old i3 laptop, with 8GB of RAM. We generated 20 million logs, sent them to rsyslog via TCP and from there to Elasticsearch in the Logstash format, so they can get explored with Kibana. The objective was to stuff as many events per second into Elasticsearch as possible.
Rsyslog Architecture Overview
In order to tweak rsyslog effectively, one needs to understand its architecture, which is not that obvious (although there’s an ongoing effort to improve the documentation). The gist of it its architecture represented in the figure below.
- you have input modules taking messages (from files, TCP/UDP, journal, etc.) and pushing them to a main queue
- one or more main queue threads take those events and parse them. By default, they parse syslog formats (RFC-3164, RFC-5424 and various derivatives), but you can configure rsyslog to use message modifier modules to do additional parsing (e.g. CEE-formatted JSON messages). Either way, this parsing generates structured events, made out of properties
- after parsing, the main queue threads push events to the action queue. Or queues, if there are multiple actions and you want to fan-out
- for each defined action, one or more action queue threads takes properties from events according to templates, and makes messages that would be sent to the destination. In Elasticsearch’s case, a template should make Elasticsearch JSON documents, and the destination would be the REST API endpoint

There are two more things to say about rsyslog’s architecture before we move on to the actual test:
- you can have multiple independent flows (like the one in the figure above) in the same rsyslog process by using rulesets. Think of rulesets as swim-lanes. They’re useful for example when you want to process local logs and remote logs in a completely separate manner
- queues can be in-memory, on disk, or a combination called disk-assisted. Here, we’ll use in-memory because they’re the fastest. For more information about how queues work, take a look here
Configuration
To generate messages, we used tcpflood, a small and light tool that’s part of rsyslog’s testbench. It generates messages and sends them over to the local syslog via TCP.
Rsyslog took received those messages with the imtcp input module, queued them and forwarded them to Elasticsearch 0.90.7, which was also installed locally. We also tried with Elasticsearch 1.0 and got the same results (see below).
The flow of messages in this test is represented in the following figure:

The actual rsyslog config is listed below (in the new configuration format). It can be tuned further (for example by using the multithreaded imptcp input module), but we didn’t get significant improvements in this particular scenario.
module(load="imtcp")   # TCP input module
module(load="omelasticsearch") # Elasticsearch output module

input(type="imtcp" port="13514")  # where to listen for TCP messages

main_queue(
  queue.size="1000000"   # capacity of the main queue
  queue.dequeuebatchsize="1000"  # process messages in batches of 1000 and move them to the action queues
  queue.workerthreads="2"  # 2 threads for the main queue
)

# template to generate JSON documents for Elasticsearch in Logstash format
template(name="plain-syslog"
         type="list") {
           constant(value="{")
             constant(value="\"@timestamp\":\"")      property(name="timereported" dateFormat="rfc3339")
             constant(value="\",\"host\":\"")        property(name="hostname")
             constant(value="\",\"severity\":\"")    property(name="syslogseverity-text")
             constant(value="\",\"facility\":\"")    property(name="syslogfacility-text")
             constant(value="\",\"syslogtag\":\"")   property(name="syslogtag" format="json")
             constant(value="\",\"message\":\"")    property(name="msg" format="json")
             constant(value="\"}")
         }

action(type="omelasticsearch"
       template="plain-syslog"  # use the template defined earlier
       searchIndex="test-index"
       bulkmode="on"                   # use the Bulk API
       queue.dequeuebatchsize="5000"   # ES bulk size
       queue.size="100000"   # capacity of the action queue
       queue.workerthreads="5"   # 5 workers for the action
       action.resumeretrycount="-1"  # retry indefinitely if ES is unreachable
)
You can see from the configuration that:
- both main and action queues have a defined size in number of messages
- both have number of threads that deliver messages to the next step. The action needs more because it has to wait for Elasticsearch to reply
- moving of messages from the queues happens in batches. For the Elasticsearch output, the batch of messages is sent through the Bulk API, which makes queue.dequeuebatchsize effectively the bulk size
Results
We started with default Elasticsearch settings. Then we tuned them to leave rsyslog with a more significant slice of the CPU. We monitored the indexing rate with SPM for Elasticsearch. Here are the average results over 20 million indexed events:
- with default Elasticsearch settings, we got 8,000 events per second
- after setting Elasticsearch up more production-like (5 second refresh interval, increased index buffer size, translog thresholds, etc), and the throughput went up to average of 20,000 events per second
- in the end, we went berserk and used in-memory indices, updated the mapping to disable any storing or indexing for any field, to have Elasticsearch do as little work as possible and make room for rsyslog. Got an average of 30,000 events per second. In this scenario, rsyslog was using between 1 and 1.5 of the 4 virtual CPU cores, with tcpflood using 0.5 and Elasticsearch using from 2 to 2.5
Conclusion
20K EPS on a low-end machine with production-like configuration means Elasticsearch is quick at indexing. This is very good for logs, where you typically have lots of messages being generated, compared to how often you search.
If you need some tool to ship your logs to Elasticsearch with minimum overhead, rsyslog version 8 may well be your best bet.
Related posts:
rsyslog statistic counter Queues
Queue
For each queue inside the system its own set of statistics counters is created. If there are multiple action (or main) queues, this can become a rather lengthy list. The stats record begins with the queue name (e.g. “main Q” for the main queue; ruleset queues have the name of the ruleset they are associated to, action queues the name of the action).
- size – currently active messages in queue
- enqueued – total number of messages enqueued into this queue since startup
- maxsize – maximum number of active messages the queue ever held
- full – number of times the queue was actually full and could not accept additional messages
- discarded.full – number of messages discarded because the queue was full
- discarded.nf – number of messages discarded because the queue was nearly full. Starting at this point, messages of lower-than-configured severity are discarded to save space for higher severity ones.
Changelog for 8.1.2 (v8-devel)
Version 8.1.2 [devel] 2013-11-28
- support for liblognorm1 added – results in performance improvements
Thanks to Pavel Levshin for his work in this regard. - support for jemalloc added via –enable-jemalloc
Thanks to Pavel Levshin for suggesting jemalloc - queue defaults have changed
- high water mark is now dynamically 90% of queue size
- low water makr is now dynamically 70% of queue size
- queue.discardMark is now dynamically 98% of queue size
- queue.
workerThreadMinimumMessage set to queue.size / num workers
For queues with very low queue.maxSize (< 100), “emergency” defaults will be used.
Note that build system is experimental at this stage. - bugfix: disk queues created files in wrong working directory
if the $WorkDirectory was changed multiple times, all queues only used the last value set. - bugfix: legacy directive $ActionQueueWorkerThreads was not honored
- bugfix: mmrfc5424addhmac: “key” parameter was not properly processed
impstats delayed or lost? – cause and cure
Some users report that they do not receive all impstats log records or that these log records are delayed. The common thing about these questions is that those user tend to have very large main message queues.
By default, impstats is run in-band, which means that it’s messages are submitted to the main message queue just like any other messages are. So if the main queue takes very long to processs, impstats messages get delayed as well. They may be discarded, too, based on queue settings and queue full status. In this scenarios, impstats obviously has problems reporting what is going on.
A simple solution is to run impstats off-band. This is done by simply instructing it to directly write to file. In that mode, the rsyslog engine is not used at all, and output will always be available and happen right on the interval. There is a drawback, though: as the rsyslog core engine is not involved, things like dynafiles, different templates or forwarding to another host are not possible.
Note that impstats can submit messages both to a file and the regular message stream. This may be an interesting alternative if the main queue causes trouble but usually logs shall be gathered at some central place.
Example for writing to a local file:
module(load="impstats" interval="600" severity="7" log.file="/var/log/impstats")
Encrypted disk queues
This guide will tell you, how to quickly protect your disk queue through encryption. So you can be sure that unauthorized persons can’t read your queue.
Please note that we only use the “disk” queue format in this guide to show you the encrypted files but normally we recommend you to use the “LinkedList” queue format for a better performance.
This feature is available from version 7.5.0 or higher. In addition to rsyslog we need the most current version of librelp.
The Intention
Whenever two systems talk over a network, something can go wrong. For example, the communications link may go down, or a client or server may abort. Even in regular cases, the server may be offline for a short period of time because of routine maintenance.
A logging system should be capable of avoiding message loss in situations where the server is not reachable. To do so, unsent data needs to be buffered at the client while the server is offline. Then, once the server is up again, this data is to be sent.
This can easily be acomplished by rsyslog. In rsyslog, every action runs on its own queue and each queue can be set to buffer data if the action is not ready. Of course, you must be able to detect that “the action is not ready”, which means the remote server is offline. This can be detected with plain TCP syslog and RELP, but not with UDP. So you need to use either of the two. In this howto, we use plain TCP syslog.
Please note that we are using rsyslog-specific features. The are required on the client, but not on the server. So the client system must run rsyslog (at least version 7.5.0), while on the server another syslogd may be running, as long as it supports plain tcp syslog.
Normally the rsyslog queueing subsystem tries to buffer to memory if you use the “LinkedList” queue typ. So even if the remote server goes offline, no disk file is generated. File on disk are created only if there is need to, for example if rsyslog runs out of (configured) memory queue space or needs to shutdown (and thus persist yet unsent messages). Using main memory and going to the disk when needed is a huge performance benefit. But in this case we only want to create a disk queue which is encrypted. So we use “Disk” as the queue typ, disk means that rsyslog writes immediately.
How To Setup
First, you need to create a working directory for rsyslog. This is where it stores its queue files (should need arise). You may use any location on your local system.
What have to do next is instruct rsyslog to use a disk queue and then configure your action. There is nothing else to do. With the following simple config file, you forward anything you receive to a remote server and have buffering applied automatically. This must be done on the client machine.
module(load=” imuxsock”) # local message reception
$WorkDirectory /home/test/rsyslog/work # default location for work (spool) filesaction(type=”omfwd”
queue.type=”disk” queue.fileName=”enc”
queue.cry.provider=”gcry” queue.cry.key=”/path/to/contrib/gnutls/key.pem”
target=”172.123.123.5
port=”10514″)
The “queue.fileName=”enc”” is used to create encrypted queue files, should need arise. This value must be unique inside rsyslog.conf. No two rules must use the same queue file. Also, for obvious reasons, it must only contain those characters that can be used inside a valid file name. Rsyslog possibly adds some characters in front and/or at the end of that name when it creates files. So that name should not be at the file size name length limit (which should not be a problem these days).
In the next value “queue.cry.key=”/path/to/key”” you have to provide the path to your keyfile, if this path is invalid rsyslog will not encrypt your queue files.
Please note that actual spool files are directly created because we use the “disk” mode, if you use the “LinkedList” mode then they are only created if the remote server is down and there is no more space in the in-memory queue. By default, a short failure of the remote server will never result in the creation of a disk file as a couple of hundered messages can be held in memory by default. [These parameters can be fine-tuned. However, then you need to either fully understand how the queue works (read elaborate doc) or use professional services to have it done based on your specs ;) – what that means is that fine-tuning queue parameters is far from being trivial…]
If you would like to test the encryption scenario, you need to stop, wait a while and restart your server. Then simply open a new generated queue file they should all be encrypted now.