Connecting with Logstash via Apache Kafka
Original post: Recipe: rsyslog + Kafka + Logstash by @Sematext
This recipe is similar to the previous rsyslog + Redis + Logstash one, except that we’ll use Kafka as a central buffer and connecting point instead of Redis. You’ll have more of the same advantages:
- rsyslog is light and crazy-fast, including when you want it to tail files and parse unstructured data (see the Apache logs + rsyslog + Elasticsearch recipe)
- Kafka is awesome at buffering things
- Logstash can transform your logs and connect them to N destinations with unmatched ease
There are a couple of differences to the Redis recipe, though:
- rsyslog already has Kafka output packages, so it’s easier to set up
- Kafka has a different set of features than Redis (trying to avoid flame wars here) when it comes to queues and scaling
As with the other recipes, I’ll show you how to install and configure the needed components. The end result would be that local syslog (and tailed files, if you want to tail them) will end up in Elasticsearch, or a logging SaaS like Logsene (which exposes the Elasticsearch API for both indexing and searching). Of course you can choose to change your rsyslog configuration to parse logs as well (as we’ve shown before), and change Logstash to do other things (like adding GeoIP info).
Getting the ingredients
First of all, you’ll probably need to update rsyslog. Most distros come with ancient versions and don’t have the plugins you need. From the official packages you can install:
- rsyslog. This will update the base package, including the file-tailing module
- rsyslog-kafka. This will get you the Kafka output module
If you don’t have Kafka already, you can set it up by downloading the binary tar. And then you can follow the quickstart guide. Basically you’ll have to start Zookeeper first (assuming you don’t have one already that you’d want to re-use):
bin/zookeeper-server-start.sh config/zookeeper.properties
And then start Kafka itself and create a simple 1-partition topic that we’ll use for pushing logs from rsyslog to Logstash. Let’s call it rsyslog_logstash:
bin/kafka-server-start.sh config/server.properties
bin/kafka-topics.sh --create --zookeeper localhost:2181 --replication-factor 1 --partitions 1 --topic rsyslog_logstash
Finally, you’ll have Logstash. At the time of writing this, we have a beta of 2.0, which comes with lots of improvements (including huge performance gains of the GeoIP filter I touched on earlier). After downloading and unpacking, you can start it via:
bin/logstash -f logstash.conf
Though you also have packages, in which case you’d put the configuration file in /etc/logstash/conf.d/ and start it with the init script.
Configuring rsyslog
With rsyslog, you’d need to load the needed modules first:
module(load="imuxsock")  # will listen to your local syslog
module(load="imfile")    # if you want to tail files
module(load="omkafka")   # lets you send to Kafka
If you want to tail files, you’d have to add definitions for each group of files like this:
input(type="imfile"
  File="/opt/logs/example*.log"
  Tag="examplelogs"
)
Then you’d need a template that will build JSON documents out of your logs. You would publish these JSON’s to Kafka and consume them with Logstash. Here’s one that works well for plain syslog and tailed files that aren’t parsed via mmnormalize:
template(name="json_lines" type="list" option.json="on") {
  constant(value="{")
  constant(value="\"timestamp\":\"")
  property(name="timereported" dateFormat="rfc3339")
  constant(value="\",\"message\":\"")
  property(name="msg")
  constant(value="\",\"host\":\"")
  property(name="hostname")
  constant(value="\",\"severity\":\"")
  property(name="syslogseverity-text")
  constant(value="\",\"facility\":\"")
  property(name="syslogfacility-text")
  constant(value="\",\"syslog-tag\":\"")
  property(name="syslogtag")
  constant(value="\"}")
}
By default, rsyslog has a memory queue of 10K messages and has a single thread that works with batches of up to 16 messages (you can find all queue parameters here). You may want to change:
– the batch size, which also controls the maximum number of messages to be sent to Kafka at once
– the number of threads, which would parallelize sending to Kafka as well
– the size of the queue and its nature: in-memory(default), disk or disk-assisted
In a rsyslog->Kafka->Logstash setup I assume you want to keep rsyslog light, so these numbers would be small, like:
main_queue(
  queue.workerthreads="1"      # threads to work on the queue
  queue.dequeueBatchSize="100" # max number of messages to process at once
  queue.size="10000"           # max queue size
)
Finally, to publish to Kafka you’d mainly specify the brokers to connect to (in this example we have one listening to localhost:9092) and the name of the topic we just created:
action(
  broker=["localhost:9092"]
  type="omkafka"
  topic="rsyslog_logstash"
  template="json"
)
Assuming Kafka is started, rsyslog will keep pushing to it.
Configuring Logstash
This is the part where we pick the JSON logs (as defined in the earlier template) and forward them to the preferred destinations. First, we have the input, which will use to the Kafka topic we created. To connect, we’ll point Logstash to Zookeeper, and it will fetch all the info about Kafka from there:
input {
  kafka {
    zk_connect => "localhost:2181"
    topic_id => "rsyslog_logstash"
  }
}
At this point, you may want to use various filters to change your logs before pushing to Logsene/Elasticsearch. For this last step, you’d use the Elasticsearch output:
output {
  elasticsearch {
    hosts => "localhost" # it used to be "host" pre-2.0
    port => 9200
    #ssl => "true"
    #protocol => "http" # removed in 2.0
  }
}
And that’s it! Now you can use Kibana (or, in the case of Logsene, either Kibana or Logsene’s own UI) to search your logs!
Coupling with Logstash via Redis
Original post: Recipe: rsyslog + Redis + Logstash by @Sematext
OK, so you want to hook up rsyslog with Logstash. If you don’t remember why you want that, let me give you a few hints:
- Logstash can do lots of things, it’s easy to set up but tends to be too heavy to put on every server
- you have Redis already installed so you can use it as a centralized queue. If you don’t have it yet, it’s worth a try because it’s very light for this kind of workload.
- you have rsyslog on pretty much all your Linux boxes. It’s light and surprisingly capable, so why not make it push to Redis in order to hook it up with Logstash?
In this post, you’ll see how to install and configure the needed components so you can send your local syslog (or tail files with rsyslog) to be buffered in Redis so you can use Logstash to ship them to Elasticsearch, a logging SaaS like Logsene (which exposes the Elasticsearch API for both indexing and searching) so you can search and analyze them with Kibana:

Output to Elasticsearch in Logstash format (Kibana-friendly)
Original post: Recipe rsyslog+Elasticsearch+Kibana by @Sematext
In this post you’ll see how you can take your logs with rsyslog and ship them directly to Elasticsearch (running on your own servers, or the one behind Logsene’s Elasticsearch API) in a format that plays nicely with Logstash. So you can use Kibana to search, analyze and make pretty graphs out of them.
This is especially useful when you have a lot of servers logging [a lot of data] to their syslog daemons and you want a way to search them quickly or do statistics on the logs. You can use rsyslog’s Elasticsearch output to get your logs into Elasticsearch, and Kibana to visualize them. The only challenge is to get your rsyslog configuration right, so your logs end up where Kibana is expecting them. And this is exactly what we’re doing here.
Getting all the ingredients
Here’s what you’ll need:
- a recent version of rsyslog (v8+ is recommended for best performance, although the Elasticsearch output is available since 6.4.0). You can download and compile it yourself, or you can get it from the RHEL/CentOS or Ubuntu repositories
- the Elasticsearch output plugin for rsyslog. If you compile rsyslog from sources, you’ll need to add the –enable-elasticsearch parameter to the configure script. If you use the repositories, just install the rsyslog-elasticsearch package
- Elasticsearch :). You have a DEB and a RPM there, which should get you started in no time. If you choose the tar.gz archive, you might find the installation instructions useful
- Kibana 3 and a web server to serve it. There are installation instructions on the GitHub page. To get started quickly, you can try the tar.gz archive from the download page that gets you Elasticsearch, too
Then, you’ll probably need to edit config.js to change the Elasticsearch host name from “localhost” to the actual FQDN of the host that’s running Elasticsearch. This applies even if Kibana is on the same machine as Elasticsearch. “localhost” only works if your browser is on the same machine as Elasticsearch, because Kibana talks to Elasticsearch directly from your browser.
Finally, you can serve the Kibana page with any HTTP server you prefer. If you want to get started quickly, you can try SimpleHTTPServer, which should be embedded to any recent Python, by running this command from the “kibana” directory:
python -m SimpleHTTPServer
Putting them all together
Kibana is, by default, expecting Logstash to send logs to Elasticsearch. So “putting them all together” here means “configuring rsyslog to send logs to Elasticsearch in the same manner Logstash does”. And Logstash, by default, has some particular ways when it comes to naming the indices and formatting the logs:
- indices should be formatted like logstash-YYYY.MM.DD. You can change the pattern Kibana is looking for, but we won’t do that here
- logs must have a timestamp, and that timestamp must be stored in the @timestamp field. It’s also nice to put the message part in the message field – because Kibana shows it by default
To satisfy the requirements above, here’s a rsyslog configuration that should work for sending your local syslog logs to Elasticsearch in a Logstash/Kibana-friendly way:
module(load="imuxsock") # for listening to /dev/log
module(load="omelasticsearch") # for outputting to Elasticsearch
# this is for index names to be like: logstash-YYYY.MM.DD
template(name="logstash-index"
type="list") {
constant(value="logstash-")
property(name="timereported" dateFormat="rfc3339" position.from="1" position.to="4")
constant(value=".")
property(name="timereported" dateFormat="rfc3339" position.from="6" position.to="7")
constant(value=".")
property(name="timereported" dateFormat="rfc3339" position.from="9" position.to="10")
}
# this is for formatting our syslog in JSON with @timestamp
template(name="plain-syslog"
type="list") {
constant(value="{")
constant(value="\"@timestamp\":\"") property(name="timereported" dateFormat="rfc3339")
constant(value="\",\"host\":\"") property(name="hostname")
constant(value="\",\"severity\":\"") property(name="syslogseverity-text")
constant(value="\",\"facility\":\"") property(name="syslogfacility-text")
constant(value="\",\"tag\":\"") property(name="syslogtag" format="json")
constant(value="\",\"message\":\"") property(name="msg" format="json")
constant(value="\"}")
}
# this is where we actually send the logs to Elasticsearch (localhost:9200 by default)
action(type="omelasticsearch"
template="plain-syslog"
searchIndex="logstash-index"
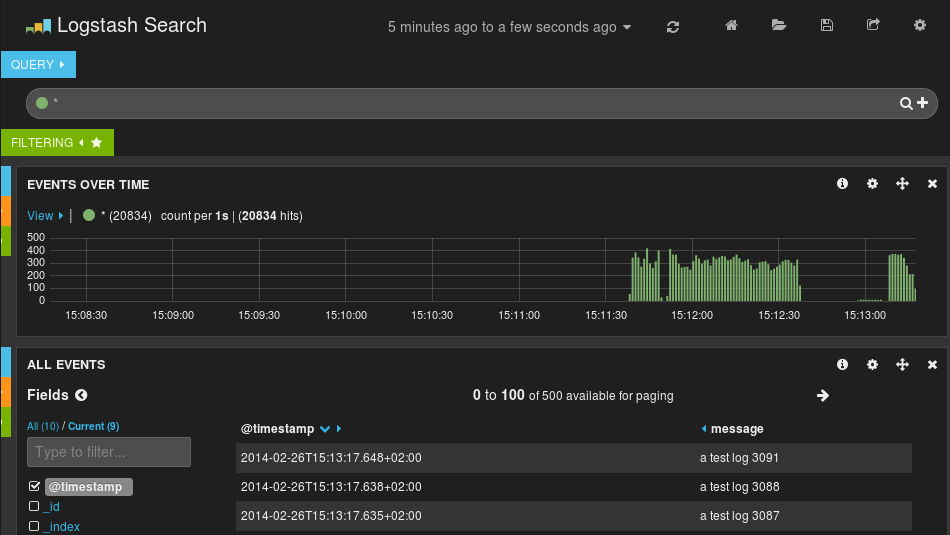
dynSearchIndex="on")After restarting rsyslog, you can go to http://host-serving-Kibana:8000/ in your browser and start searching and graphing your logs:
More tips
Now that you got the essentials working, here are some tips that might help you go even further with your centralized logging setup:
- you might not want to put the new rsyslog and omelasticsearch on all your servers. In this case you can forward them over the network to a central rsyslog that has omelasticsearch, and push your logs to Elasticsearch from there. Some information on forwarding logs via TCP can be found here and here
- you might want rsyslog to buffer your logs (in memory, on disk, or some combination of the two), in case Elasticsearch is not available for some reason. Buffering will also help performance, as you can send messages in bulks instead of one by one. There’s a reference on buffers with rsyslog&omelasticsearch here
- you might want to parse JSON-formatted (CEE) syslog messages. If you’re using them, check our earlier post on the subject: JSON logging with rsyslog and Elasticsearch
You can also hook rsyslog up to a log analytics service like Logsene, by either shipping logs via omelasticsearch or by sending them via UDP/TCP/RELP syslog protocols.