rsyslog 8.26.0 (v8-stable) released
We have released rsyslog 8.26.0.
This release has liblognorm 2.0.3 as a build requirement. Also, there were quite some changes like internal error messages are enabled at all times and many more fixes and additions to modules like imrelp, imptcp, omfwd and many many more.
For a complete list of changes, fixes and enhancements, please visit the ChangeLog.
https://github.com/rsyslog/rsyslog/blob/v8-stable/ChangeLog
Download:
http://www.rsyslog.com/downloads/download-v8-stable/
As always, feedback is appreciated.
Best regards,
Florian Riedl
Monitoring rsyslog’s impstats with Kibana and SPM
Original post: Monitoring rsyslog with Kibana and SPM by @Sematext
A while ago we published this post where we explained how you can get stats about rsyslog, such as the number of messages enqueued, the number of output errors and so on. The point was to send them to Elasticsearch (or Logsene, our logging SaaS, which exposes the Elasticsearch API) in order to analyze them.
This is part 2 of that story, where we share how we process these stats in production. We’ll cover:
- an updated config, working with Elasticsearch 2.x
- what Kibana dashboards we have in Logsene to get an overview of what rsyslog is doing
- how we send some of these metrics to SPM as well, in order to set up alerts on their values: both threshold-based alerts and anomaly detection
Continue reading “Monitoring rsyslog’s impstats with Kibana and SPM”
Recipe: Apache Logs + rsyslog (parsing) + Elasticsearch
Original post: Recipe: Apache Logs + rsyslog (parsing) + Elasticsearch by @Sematext
This recipe is about tailing Apache HTTPD logs with rsyslog, parsing them into structured JSON documents, and forwarding them to Elasticsearch (or a log analytics SaaS, like Logsene, which exposes the Elasticsearch API). Having them indexed in a structured way will allow you to do better analytics with tools like Kibana:

We’ll also cover pushing logs coming from the syslog socket and kernel, and how to buffer all of them properly. So this is quite a complete recipe for your centralized logging needs.
Getting the ingredients
Even though most distros already have rsyslog installed, it’s highly recommended to get the latest stable from the rsyslog repositories. The packages you’ll need are:
- rsyslog. The base package, including the file-tailing module (imfile)
- rsyslog-mmnormalize. This gives you mmnormalize, a module that will do the parsing of common Apache logs to JSON
- rsyslog-elasticsearch, for the Elasticsearch output
With the ingredients in place, let’s start cooking a configuration. The configuration needs to do the following:
- load the required modules
- configure inputs: tailing Apache logs and system logs
- configure the main queue to buffer your messages. This is also the place to define the number of worker threads and batch sizes (which will also be Elasticsearch bulk sizes)
- parse common Apache logs into JSON
- define a template where you’d specify how JSON messages would look like. You’d use this template to send logs to Logsene/Elasticsearch via the Elasticsearch output
Loading modules
Here, we’ll need imfile to tail files, mmnormalize to parse them, and omelasticsearch to send them. If you want to tail the system logs, you’d also need to include imuxsock and imklog (for kernel logs).
# system logs
module(load="imuxsock")
module(load="imklog")
# file
module(load="imfile")
# parser
module(load="mmnormalize")
# sender
module(load="omelasticsearch")
Configure inputs
For system logs, you typically don’t need any special configuration (unless you want to listen to a non-default Unix Socket). For Apache logs, you’d point to the file(s) you want to monitor. You can use wildcards for file names as well. You also need to specify a syslog tag for each input. You can use this tag later for filtering.
input(type="imfile"
      File="/var/log/apache*.log"
      Tag="apache:"
)NOTE: By default, rsyslog will not poll for file changes every N seconds. Instead, it will rely on the kernel (via inotify) to poke it when files get changed. This makes the process quite realtime and scales well, especially if you have many files changing rarely. Inotify is also less prone to bugs when it comes to file rotation and other events that would otherwise happen between two “polls”. You can still use the legacy mode=”polling” by specifying it in imfile’s module parameters.
Queue and workers
By default, all incoming messages go into a main queue. You can also separate flows (e.g. files and system logs) by using different rulesets but let’s keep it simple for now.
For tailing files, this kind of queue would work well:
main_queue(
  queue.workerThreads="4"
  queue.dequeueBatchSize="1000"
  queue.size="10000"
)
This would be a small in-memory queue of 10K messages, which works well if Elasticsearch goes down, because the data is still in the file and rsyslog can stop tailing when the queue becomes full, and then resume tailing. 4 worker threads will pick batches of up to 1000 messages from the queue, parse them (see below) and send the resulting JSONs to Elasticsearch.
If you need a larger queue (e.g. if you have lots of system logs and want to make sure they’re not lost), I would recommend using a disk-assisted memory queue, that will spill to disk whenever it uses too much memory:
main_queue(
  queue.workerThreads="4"
  queue.dequeueBatchSize="1000"
  queue.highWatermark="500000"    # max no. of events to hold in memory
  queue.lowWatermark="200000"     # use memory queue again, when it's back to this level
  queue.spoolDirectory="/var/run/rsyslog/queues"  # where to write on disk
  queue.fileName="stats_ruleset"
  queue.maxDiskSpace="5g"        # it will stop at this much disk space
  queue.size="5000000"           # or this many messages
  queue.saveOnShutdown="on"      # save memory queue contents to disk when rsyslog is exiting
)
Parsing with mmnormalize
The message normalization module uses liblognorm to do the parsing. So in the configuration you’d simply point rsyslog to the liblognorm rulebase:
action(type="mmnormalize"
  rulebase="/opt/rsyslog/apache.rb"
)
where apache.rb will contain rules for parsing apache logs, that can look like this:
version=2

rule=:%clientip:word% %ident:word% %auth:word% [%timestamp:char-to:]%] "%verb:word% %request:word% HTTP/%httpversion:float%" %response:number% %bytes:number% "%referrer:char-to:"%" "%agent:char-to:"%"%blob:rest%
Where version=2 indicates that rsyslog should use liblognorm’s v2 engine (which is was introduced in rsyslog 8.13) and then you have the actual rule for parsing logs. You can find more details about configuring those rules in the liblognorm documentation.
Besides parsing Apache logs, creating new rules typically requires a lot of trial and error. To check your rules without messing with rsyslog, you can use the lognormalizer binary like:
head -1 /path/to/log.file | /usr/lib/lognorm/lognormalizer -r /path/to/rulebase.rb -e json
NOTE: If you’re used to Logstash’s grok, this kind of parsing rules will look very familiar. However, things are quite different under the hood. Grok is a nice abstraction over regular expressions, while liblognorm builds parse trees out of specialized parsers. This makes liblognorm much faster, especially as you add more rules. In fact, it scales so well, that for all practical purposes, performance depends on the length of the log lines and not on the number of rules. This post explains the theory behind this assuption, and this is actually proven by various tests. The downside is that you’ll lose some of the flexibility offered by regular expressions. You can still use regular expressions with liblognorm (you’d need to set allow_regex to on when loading mmnormalize) but then you’d lose a lot of the benefits that come with the parse tree approach.
Template for parsed logs
Since we want to push logs to Elasticsearch as JSON, we’d need to use templates to format them. For Apache logs, by the time parsing ended, you already have all the relevant fields in the $!all-json variable, that you’ll use as a template:
template(name="all-json" type="list"){
  property(name="$!all-json")
}
Template for time-based indices
For the logging use-case, you’d probably want to use time-based indices (e.g. if you keep your logs for 7 days, you can have one index per day). Such a design will give your cluster a lot more capacity due to the way Elasticsearch merges data in the background (you can learn the details in our presentations at GeeCON and Berlin Buzzwords).
To make rsyslog use daily or other time-based indices, you need to define a template that builds an index name off the timestamp of each log. This is one that names them logstash-YYYY.MM.DD, like Logstash does by default:
template(name="logstash-index"
  type="list") {
    constant(value="logstash-")
    property(name="timereported" dateFormat="rfc3339" position.from="1" position.to="4")
    constant(value=".")
    property(name="timereported" dateFormat="rfc3339" position.from="6" position.to="7")
    constant(value=".")
    property(name="timereported" dateFormat="rfc3339" position.from="9" position.to="10")
}
And then you’d use this template in the Elasticsearch output:
action(type="omelasticsearch"
  template="all-json"
  dynSearchIndex="on"
  searchIndex="logstash-index"
  searchType="apache"
  server="MY-ELASTICSEARCH-SERVER"
  bulkmode="on"
  action.resumeretrycount="-1"
)
Putting both Apache and system logs together
If you use the same rsyslog to parse system logs, mmnormalize won’t parse them (because they don’t match Apache’s common log format). In this case, you’ll need to pick the rsyslog properties you want and build an additional JSON template:
template(name="plain-syslog"
  type="list") {
    constant(value="{")
      constant(value="\"timestamp\":\"")     property(name="timereported" dateFormat="rfc3339")
      constant(value="\",\"host\":\"")        property(name="hostname")
      constant(value="\",\"severity\":\"")    property(name="syslogseverity-text")
      constant(value="\",\"facility\":\"")    property(name="syslogfacility-text")
      constant(value="\",\"tag\":\"")   property(name="syslogtag" format="json")
      constant(value="\",\"message\":\"")    property(name="msg" format="json")
    constant(value="\"}")
}
Then you can make rsyslog decide: if a log was parsed successfully, use the all-json template. If not, use the plain-syslog one:
if $parsesuccess == "OK" then {
 action(type="omelasticsearch"
  template="all-json"
  ...
 )
} else {
 action(type="omelasticsearch"
  template="plain-syslog"
  ...
 )
}
And that’s it! Now you can restart rsyslog and get both your system and Apache logs parsed, buffered and indexed into Elasticsearch. If you’re a Logsene user, the recipe is a bit simpler: you’d follow the same steps, except that you’ll skip the logstash-index template (Logsene does that for you) and your Elasticsearch actions will look like this:
action(type="omelasticsearch"
  template="all-json or plain-syslog"
  searchIndex="LOGSENE-APP-TOKEN-GOES-HERE"
  searchType="apache"
  server="logsene-receiver.sematext.com"
  serverport="80"
  bulkmode="on"
  action.resumeretrycount="-1"
)
rsyslog 8.1.2 (v8-devel) released
We have just released 8.1.2 of the v8-devel branch. This is primarily a maintenance release, but offers some improvements. Thanks to Pavel Levshin, mmnormalize now offers higher performance and we have added the ability to link directly to jemalloc. Also, usability of queue settings has been improved by using better (and dynamic) defaults for a range of settings.
ChangeLog:
http://www.rsyslog.com/changelog-for-8-1-2-v8-devel/
Download:
http://www.rsyslog.com/rsyslog-8-1-2-v8-devel/
Feedback is *very much* appreciated.
Best regards,
Florian Riedl
Changelog for 8.1.2 (v8-devel)
Version 8.1.2 [devel] 2013-11-28
- support for liblognorm1 added – results in performance improvements
Thanks to Pavel Levshin for his work in this regard. - support for jemalloc added via –enable-jemalloc
Thanks to Pavel Levshin for suggesting jemalloc - queue defaults have changed
- high water mark is now dynamically 90% of queue size
- low water makr is now dynamically 70% of queue size
- queue.discardMark is now dynamically 98% of queue size
- queue.
workerThreadMinimumMessage set to queue.size / num workers
For queues with very low queue.maxSize (< 100), “emergency” defaults will be used.
Note that build system is experimental at this stage. - bugfix: disk queues created files in wrong working directory
if the $WorkDirectory was changed multiple times, all queues only used the last value set. - bugfix: legacy directive $ActionQueueWorkerThreads was not honored
- bugfix: mmrfc5424addhmac: “key” parameter was not properly processed
Normalizing Cisco ASA messages
This time, we want to parse log messages received from a Cisco ASA for specific parts. The log messages will be parsed by liblognorm and then they will be written into a specific file resembling the sent code.
This guide has been tested with v7.3.4 of rsyslog.
Things to think about
We basically need a receiver, the normalizer module mmnormalize, some templates and several actions. To keep the logs seperated from other log messages, we also will need a filter. But that is just valid for the rsyslog configuration.
We also need liblognorm installed and a rulebase to work with. The rulebase is needed for liblognorm to know what to do with the messages, so it knows, which part should be fed into a custom property and which to ignore.
Config Statements
We now have basically two parts to configure. The first part should be the rulebase which holds format representations of the expected log messages. For this example we will work with the following log line:
2012-11-23T10:47:42+01:00 0.0.0.0 : %ASA-3-313001: Denied ICMP type=8, code=0 from 77.2.2.2 on interface outside
The rulebase entry for this log line looks like this:
rule=: %date:word% %host:ipv4% : \x25ASA-%ddd:char-to:-%-%eee:number%: Denied ICMP type=%number2:number%, code=%number3:number% from %origin:ipv4% on interface outside
And here is the rsyslog configuration:
module (load="immark")
module (load="imuxsock")
module (load="imklog")
module (load="mmnormalize")
module (load="imudp")
input(type="imudp" port="514")
template(name="filename" type="string" string="/var/log/%$!ddd%-%$!eee%")
if $msg contains '%ASA' then{
 action(type="mmnormalize" userawmsg="off" rulebase="/path/to/rulebase.rb")
 action(type="omfile" DynaFile="filename")
}
How it works
The rulebase holds currently one rule. The rule is a representation of the above log message. For this case, we are only interested in the ASA code. The code identifies a specific message, thus, the message itself is not interesting. Though, we have to reflect complete message and put temporary variables, where the same message of a kind still has different values. These would be the timestamp, source, type and code the the IP which triggered the message. The problem is here, that we really only need two parts to be filled into a property, but other parts can be variable. The message format can be the same, but i.e. the IP from the source can vary. If you fill in a concrete value into the rule where such parts are, the message will only be parsed correctly if the message originates from the exact same IP.
The configuration itself isn’t very complicated. It loads several standard modules, which are mainly used to ensure local logging, as well as the UDP input module and the precious mmnormalize. The mmnormalize module will be later used as a output module. It handles the loading of the rulebase, as well as implements the normalization features of liblognorm.
After loading the modules, we have our single UDP input configured, which is necessary to receive the log messages from the Cisco ASA. Nothing fancy here, but a standard syslog receiver for UDP.
The next step is to create a template. The template is not for a message output format, but a file name format. It will help writing the messages into log files that reflect the ASA number in the filename.
Finally we will filter for “%ASA” in the message. That will ensure, that only ASA messages are processed by the following actions. The first action runs the message through mmnormalize, while using our rulebase. The messages will be parsed by liblognorm. If the messages do fit the rules in the rulebase, the parts we need will be put into properties. These properties come into play in the second action where we simply write the messages via Dynafile to disk. The template and our new properties will be used to define the filename.
Important
This configuration works or fails with the rulebase. All messages, that should be run through the normalizer must fit to a rule. If you are in doubt, that the rules are correct, follow the linked guide. It will show you how to create a output format that shows if a message has been parsed correctly or if and where the parsing broke.
Log Normalization and special characters
When trying to normalize log messages via liblognorm and mmnormalize, you need to create a rulebase first. The rulebase is usually a representation of message formats.
Due to the format of these rules, it is necessary to be cautious. Some messages and rule necessities could possibly cause confusion to the configuration interpreter. This mainly applies to clear text passages in single rules.
For example, if you have a log message from a Cisco ASA, the message looks like this:
2012-11-23T10:47:42+01:00 10.10.10.10 : %ASA-3-313001: ...
The only interesting parts are the IP and the numerical code to identify the message. We are not interested in the timestamp or “%ASA”. But when making the rule, the trouble starts there. The percent character is also used to define variables and their values in a rule. Thus it needs to be escaped. This is done with the ASCII code representation of the percent character. The rule would look like this:
rule=: %date:word% %host:ipv4% : \x25ASA-%char1:char-to:-%-%char2:number%: ...
If you write “%ASA” into the rule, the interpreter will think, that a new variable starts there. This will cause confusion to the rest of the rule and render it not working correctly. This needs to be avoided.
The same applies to “:”. But this time, it needs to be escaped when using it as delimiter vor variables. Example:
%variable:char-to:\x3a%
This will fill “variable” with everything until the next “:” occurs. If you just put a “:” here as a delimiter, the rule will not work anymore.
Log normalization and the leading space
Log normalization is simple, but has its quirks. A common pitfall is syslog message format as induced by RFC3164. Let’s look at a common case: A log message has been sent to rsyslog. The message itself had no irregular characters. But, the message that should have been parsed by mmnormalize now has a leading space character. Basically, the message that should be parsed looks like this:
This is a test
Usually, one would think, that a simple parser can be used here. You might be correct, but there is a small caveat about this. The rulebase entry we currently have looks something like this:
rule=:%word1:word% %word2:word% %word3:word% %word4%
But strangely, rsyslog responds the following:
mmnormalize generated: {“originalmsg”: ” This is a test″, “unparsed-data”: ” This is a test″}How comes, that rsyslog cannot parse the message? Why is there a leading space character in from of the message? The answer is, that messages are processed as RFC3164. In this RFC it is defined, that everything after the “:” of the syslog header is to be considered as the message. Thus, the message has a leading space now.
How is this to be solved? Simply insert the space to your rules in the rulebase. This will lead to a rule like this:
rule=: %word1:word% %word2:word% %word3:word% %word4%
Please note, that there has just the space character been added. Further, this is really only a example. The rule will fit to all messages that are 4 words long, so it is really not very suitable to be adopted to your configuration.
Using rsyslog mmnormalize module effectively with Adiscon LogAnalyzer
Using the mmnormalize module in rsyslog is a bit complicated at first. We want to describe in this article how to set up the basic components for using log normalization. In addition to that we will show how to configure these components so messages will be split into pieces of information. These pieces of information should then be written into a database for review with Adiscon LogAnalyzer.
This guide has been tested with rsyslog v5.8.0 and liblognorm 0.3, libee 0.3.
The goal of this guide is to have a setup, that will have a message parsed by the normalizing tool, put some content of the message into specific properties. These properties will then be filled into a special database format, which will should be reviewed by Adiscon LogAnalyzer.
For using normalization we need the following:
- rsyslog
- liblognorm
- libee
- libestr
In the further process of the article we need additional elements:
- apache webserver with PHP5
- mysql database (usually with phpmyadmin)
- Adiscon LogAnalyzer
Step 1: Setting up rsyslog and log normalization
First of all we need to setup rsyslog for log normalization. So before installing rsyslog, we will install liblognorm, libee and libestr. They can be installed according to this guide. rsyslog can now be installed. We assume you have downloaded and extracted a tarball from the rsyslog download page. Change into the directory you installed rsyslog in. Now use the following commands to setup rsyslog correctly:
./configure --libdir=/lib --sbindir=/sbin --enable-mysql --enable-mmnormalize
make
make install
If everything is correct, the installation procedure should complete successfully. We can now start configuring rsyslog itself. We need a configuration that looks like this:
$ModLoad immark
$ModLoad imuxsock
$ModLoad imklog
$ModLoad mmnormalize
$ModLoad ommysql.so
$ModLoad imudp.so
$UDPServerRun 514
$mmnormalizeUseRawMSG 1
$mmnormalizeRuleBase /rsyslog/rulebase.rb
*.* :mmnormalize:
$template database,"insert into normalized (date, uhost, msgnumber, protocol, ipin, ipout, portin, portout)
values ('%$!date%', '%$!uhost%', '%$!msgnumber%', '%$!protocol%', '%$!ipin%', '%$!ipout%', '%$!portin%',
'%$!portout%')",SQL
*.* :ommysql:172.19.3.17,syslog, test, test;database
That is all for our rsyslog config. Looks pretty complicated right now. Basically, we load all necessary modules at the top. After that we start the UDP syslog server. It is needed to receive the messages. The next 3 lines are the parameters to initiate the normalization of messages. We declare, that the raw message should be used. Our rulebase for the normalization lies in the rsyslog directory (this path has to be changed if your directory lies somewhere else). And after that, we tell rsyslog to use normalization on all messages. The next line describes the template for the processed message. In the end, there should be a sql insert statement that puts all the parsed variables into their corresponding fields in the table “normalized”. The last line is finally the action that makes rsyslog write all messages (the ones created by the template – the sql statement – into a remote database.
After the configuration, we still need to setup a rulebase. This is done in a separate file. For our example, the rulebase should be the following file: /rsyslog/rulebase.rb
The file should look like this:
rule=:%date:date-rfc3164% %uhost:word% %tag:word%  %notused:char-to:x3a%: %msgnumber:char-to:x3a%: access-list
inside_access_in permitted %protocol:word% inside/%ipin:ipv4%(portin:number%) ->
outside/%ipout:ipv4%(portout:number%) %notused2:char-to:]%]
The rule is basically one line. It might be shown otherwise here due to restrictions of the webdesign. It is basically a format of a message. The different parameters of a rule are shown in a different guide. The rule we have here should resemble the following message:
May 16 07:23:09 BHG-FW : %ASA-4-106100: access-list inside_access_in  permitted tcp inside/10.200.22.183(2969) ->
outside/67.192.232.82(80)  hit-cnt 1 first hit [0x48e9c345, 0x386bad81]
If you want to have multiple messages, where the format differs, you need multiple rules as well of course. The rules must be as precise as possible to resemble the message. If a message does not fit any listed rules, it will not be processed further. Something else that needs to be pointed out, is to keep the rules variable enough as well. Like in our example, there are some parts that will be the same for every message of this kind. Other parts might be with different content. And even if we do not need the content further, it should be put into a variable. Else the message might again not fit to the rule.
Step 2: Setting up the database
We suppose, that you already have a server with a database and webserver installed. The installation of the components has to be made according to the instructions given by the manufacturer of the software. Therefore we cannot give any examples for that.
But we need a specific database scheme for our example here. So we need to show this at least. As you have seen before, we have some specific parts of the message filled into properties. These properties should be written to the database. So here is the basic SQL statement to create the table according to our needs:
CREATE TABLE normalize
(
ID int unsigned not null auto_increment primary key,
date datetime NULL,
host varchar(255) NULL,
msgnumber varchar(20),
protocol varchar(60) NULL,
ipin varchar(60) NULL,
ipout varchar(60) NULL,
portin int NULL,
portout int NULL
)
You can execute this statement as you like. It is currently designed for a MySQL database, so you might need to change some bits if you are using a different database.
3. Using Adiscon LogAnalyzer with this database
Adiscon LogAnalyzer can be used to review the data from this database. Installation of Adiscon LogAnalyzer is shown here. Please note, that we will need the admin center. So please think of creating a user database when installing.
Point your browser to your Adiscon LogAnalyzer installation. Now we need to go to the admin center. There we have to set some parts to fit our custom format.
Edit Fields
First, we need to add some Fields. We need to do this, so we can use the custom fields in our database with LogAnalyzer. By default, the list of fields only reflects basically the MonitorWare Database Scheme. When clicking on Fields in the Admin Center, a list of the currently available fields will be shown:
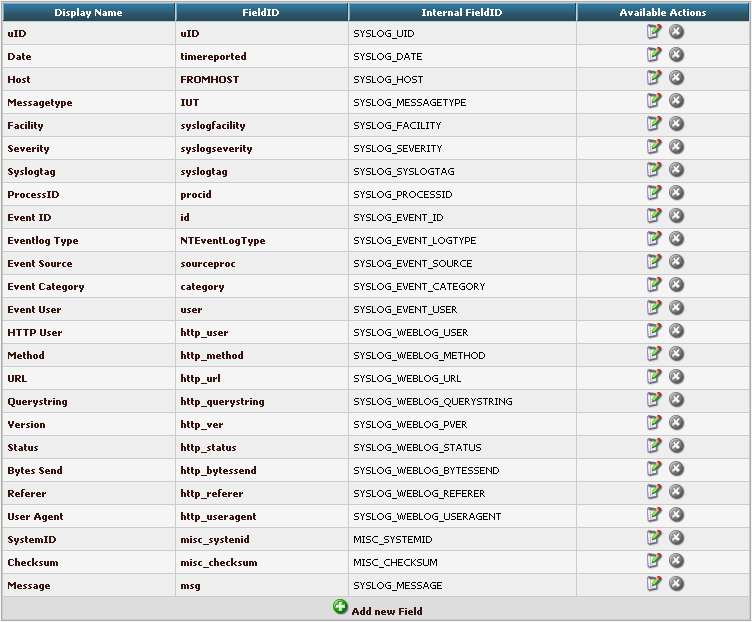
By clicking on Add new Field, we can create a new Field.
We need to create 7 new fields only, though we have 8 custom fields in the table. Since date is the same, we can use the already formatted field. So we only need to create the fields for host, msgnumber, protocol, ipin, ipout, portin and portout.
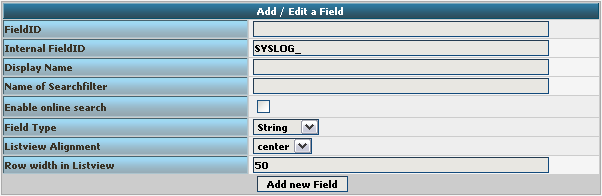
Basically, the Field details should look like this:
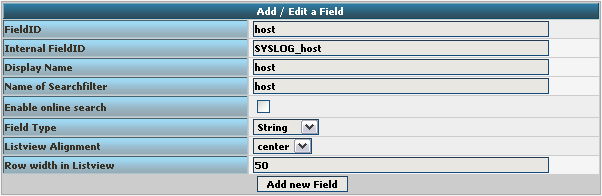
To finally create the Field, click on the button “Add new Field”. Now the list should appear again with the newly created Field. Repeat this step for the other fieldnames as well.
Edit DBMappings
In conjunction with the Fields which are only for the internal use in Adiscon LogAnalyzer, we need to create a custom database mapping. Therefore go to DBMappings in the Admin Center. You will see a list of the currently available database mappings.
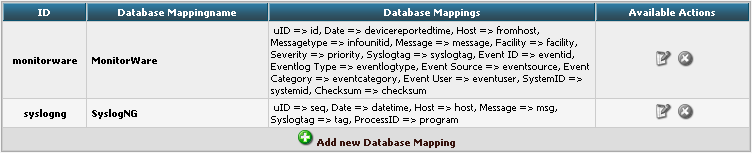
Click on Add new Database Mapping:
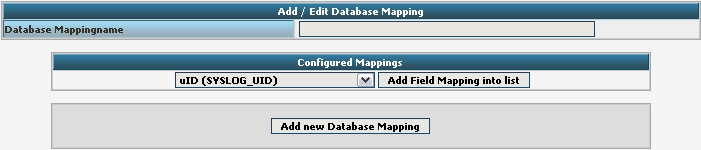
Here we need to tell Adiscon LogAnalyzer, which Field we created depends on which database field. Give your database mapping a name first. After that, choose the Fields we need from the dropdown menu and click on “Add Field Mapping into list”. The final step will be to enter the database field names into the list. It should now look like this now:
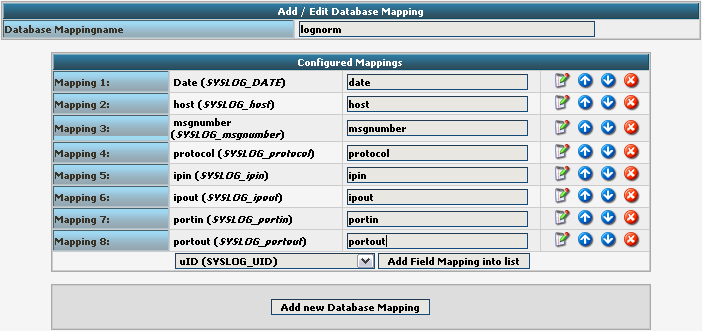
Finally click on “Add new Database Mapping”. This will save the mapping and get you back to the list of DBMappings.
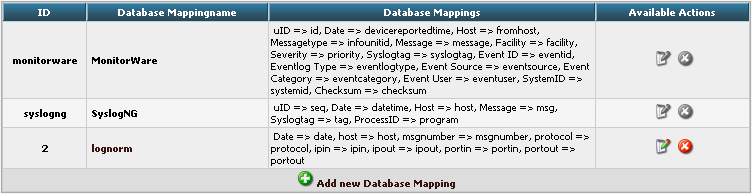
Edit Views
The next step we need to adjust is the Views. In Views you can configure, what LogAnalyzer should show. This is related to the data that is stored in the database. Basically, a View should represent the kind of logs that are stored. For example if you use the View for Windows Event Logs, but have a database where Linux syslog is stored, many Fields will be shown as empty, because they are not filled like from Windows Event Logs. Therefore we need a custom view.
You will get there by clicking on Views in the Admin Center.
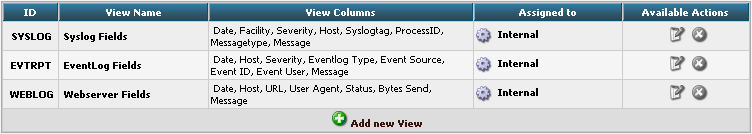
There are already pre-configured Views for Windows EventLog, Syslog and Webserver Logs. We need a completely different View though. A new View can be configured by clicking on “Add new View” at the bottom of the list.
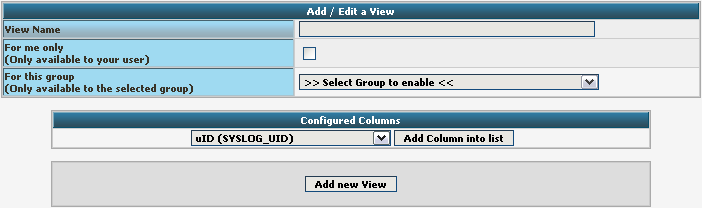
You need to give your view a name. If you want, you can restrict the use of this view to certain users or groups, but we will skip that for now. The most important part is to select the Fields that should be displayed. This is done at “Configured Columns”. Before clicking on “Add new View” it should look like this:
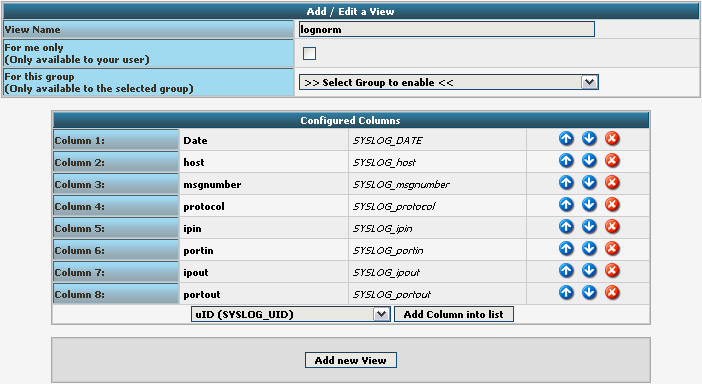
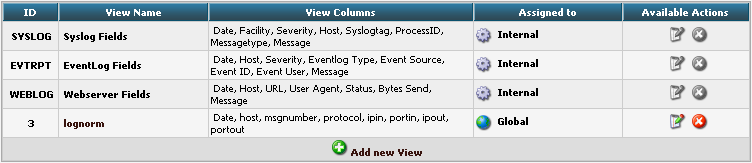
After clicking the button, the new View should appear in our list.
Edit Sources
Finally, we need to create a Source. When installing Adiscon LogAnalyzer, you can already configure a Source. For our example, we need to create another Source. Therefore go to Sources in the Admin Center.

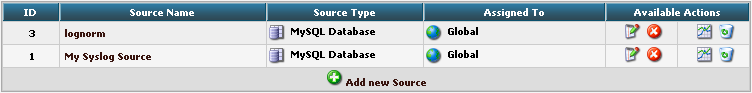
You will see a list of the configured Sources. It currently holds one Source. By clicking on Add new Source you can create another one.
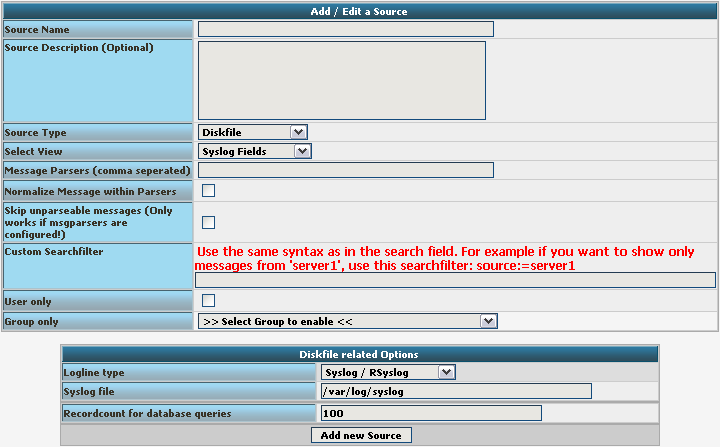
Basically, we need to insert a Source Name. If you want, you can also create a description. Change the Source Type to MYSQL Native. You can also select a default View. Choose our lognorm View we created earlier. No more general options need to be set. If you want, you can again restrict the source to a user or group.
We still need to change the database Type options. As you can see, the fields have changed by setting the Source Type to MYSQL Native. As table type choose the lognorm type we created before. Insert the details as your database needs them. The complete form should look like this now:
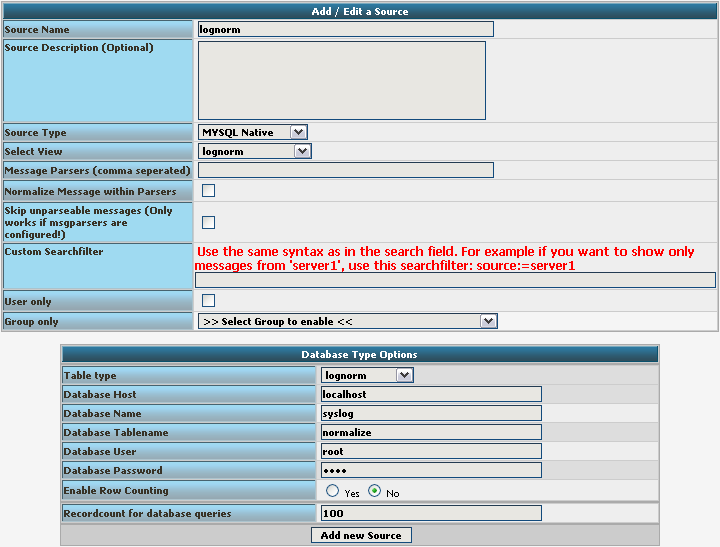
Finish the new Source by clicking on Add new Source. It should now appear in the list.
Final Thoughts
Though this scenario seems very complex it shows in the end how easy some things can be afterwards. This setup shows exactly, how different products from the Adiscon product line can work together. And we have a good example for how normalizing works.
rsyslog 6.1.2 (devel) released
Hi all,
We have just released rsyslog 6.1.2, the new v6-devel.
This release has as first release the experimental support for log Continue reading “rsyslog 6.1.2 (devel) released”