rsyslog error reporting improved
Rsyslog provides many up-to-the point error messages for config file and operational problems. These immensly helps when troubleshooting issues. Unfortunately, many users never see them. The prime reason is that most distros do never log syslog.* messages and so they are just throw away and invisible to the user. While we have been trying to make distros change their defaults, this has not been very successful. The result is a lot of user frustration and fruitless support work for the community — many things can very simple be resolved if only the error message is seen and acted on.
We have now changed our approach to this. Starting with v8.21, rsyslog now by default logs its messages via the syslog API instead of processing them internally. This is a big plus especially on systems running systemd journal: messages from rsyslogd will now show up when giving
$ systemctl status rsyslog.service
This is the place where nowadays error messages are expected and this is definitely a place where the typical administrator will see them. So while this change causes the need for some config adjustment on few exotic installations (more below), we expect this to be something that will generally improve the rsyslog user experience.
Along the same lines, we will also work on some better error reporting especially for TLS and queue-related issues, which turn out high in rsyslog suport discussions.
Some fine details on the change of behaviour:
Note: you can usually skip reading the rest of this post if you run only a single instance of rsyslog and do so with more or less default configuration.
The new behaviour was actually available for longer, It needed to be explicitly turned on in rsyslog.conf via
global(processInternalMessages="off")
Of course, distros didn’t do that by default. Also, it required rsyslog to be build with liblogging-stdlog, what many distros do not do. While our intent when we introduced this capability was to provide the better error logging we now have, it simply did not turn out in practice. The original approach was that it was less intrusive. The new method uses the native syslog() API if liblogging-stdlog is not available, so the setting always works (we even consider moving away from liblogging-stdlog, as we see this wasn’t really adopted). In essence, we have primarily changed the default setting for the “processInternalMessages” parameter. This means that by default, internal messages are no longer logged via the internal bridge to rsyslog but via the syslog() API call [either directly or
via liblogging). For the typical single-rsyslogd-instance installation this is mostly unnoticable (except for some additional latency). If multiple instances are run, only the “main” (the one processing system log messages) will see all messages. To return to the old behaviour, do either of those two:
- add in rsyslog.conf:
global(processInternalMessages="on") - export the environment variable
RSYSLOG_DFLT_LOG_INTERNAL=1
This will set a new default – the value can still be overwritten via rsyslog.conf (method 1). Note that the environment variable must be set in your startup script (which one is depending on your init system or systemd configuration).
Note that in most cases even in multiple-instance-setups rsyslog error messages were thrown away. So even in this case the behaviour is superior to the previous state – at least errors are now properly being recorded. This also means that even in multiple-instance-setups it often makes sense to keep the new default!
Using rsyslog to Reindex/Migrate Elasticsearch data
Original post: Scalable and Flexible Elasticsearch Reindexing via rsyslog by @Sematext
This recipe is useful in a two scenarios:
- migrating data from one Elasticsearch cluster to another (e.g. when you’re upgrading from Elasticsearch 1.x to 2.x or later)
- reindexing data from one index to another in a cluster pre 2.3. For clusters on version 2.3 or later, you can use the Reindex API
Back to the recipe, we used an external application to scroll through Elasticsearch documents in the source cluster and push them to rsyslog via TCP. Then we used rsyslog’s Elasticsearch output to push logs to the destination cluster. The overall flow would be:

This is an easy way to extend rsyslog, using whichever language you’re comfortable with, to support more inputs. Here, we piggyback on the TCP input. You can do a similar job with filters/parsers – you can find GeoIP implementations, for example – by piggybacking the mmexternal module, which uses stdout&stdin for communication. The same is possible for outputs, normally added via the omprog module: we did this to add a Solr output and one for SPM custom metrics.
The custom script in question doesn’t have to be multi-threaded, you can simply spin up more of them, scrolling different indices. In this particular case, using two scripts gave us slightly better throughput, saturating the network:

Writing the custom script
Before starting to write the script, one needs to know how the messages sent to rsyslog would look like. To be able to index data, rsyslog will need an index name, a type name and optionally an ID. In this particular case, we were dealing with logs, so the ID wasn’t necessary.
With this in mind, I see a number of ways of sending data to rsyslog:
- one big JSON per line. One can use mmnormalize to parse that JSON, which then allows rsyslog do use values from within it as index name, type name, and so on
- for each line, begin with the bits of “extra data” (like index and type names) then put the JSON document that you want to reindex. Again, you can use mmnormalize to parse, but this time you can simply trust that the last thing is a JSON and send it to Elasticsearch directly, without the need to parse it
- if you only need to pass two variables (index and type name, in this case), you can piggyback on the vague spec of RFC3164 syslog and send something like
destination_index document_type:{"original": "document"}
This last option will parse the provided index name in the hostname variable, the type in syslogtag and the original document in msg. A bit hacky, I know, but quite convenient (makes the rsyslog configuration straightforward) and very fast, since we know the RFC3164 parser is very quick and it runs on all messages anyway. No need for mmnormalize, unless you want to change the document in-flight with rsyslog.
Below you can find the Python code that can scan through existing documents in an index (or index pattern, like logstash_2016.05.*) and push them to rsyslog via TCP. You’ll need the Python Elasticsearch client (pip install elasticsearch) and you’d run it like this:
python elasticsearch_to_rsyslog.py source_index destination_index
The script being:
from elasticsearch import Elasticsearch
import json, socket, sys

source_cluster = ['server1', 'server2']
rsyslog_address = '127.0.0.1'
rsyslog_port = 5514

es = Elasticsearch(source_cluster,
      retry_on_timeout=True,
      max_retries=10)
s = socket.socket(socket.AF_INET, socket.SOCK_STREAM)
s.connect((rsyslog_address, rsyslog_port))


result = es.search(index=sys.argv[1], scroll='1m', search_type='scan', size=500)

while True:
  res = es.scroll(scroll_id=result['_scroll_id'], scroll='1m')
  for hit in result['hits']['hits']:
    s.send(sys.argv[2] + ' ' + hit["_type"] + ':' + json.dumps(hit["_source"])+'\n')
  if not result['hits']['hits']:
    break

s.close()
If you need to modify messages, you can parse them in rsyslog via mmjsonparse and then add/remove fields though rsyslog’s scripting language. Though I couldn’t find a nice way to change field names – for example to remove the dots that are forbidden since Elasticsearch 2.0 – so I did that in the Python script:
def de_dot(my_dict):
  for key, value in my_dict.iteritems():
    if '.' in key:
      my_dict[key.replace('.','_')] = my_dict.pop(key)
    if type(value) is dict:
      my_dict[key] = de_dot(my_dict.pop(key))
  return my_dict
And then the “send” line becomes:
s.send(sys.argv[2] + ' ' + hit["_type"] + ':' + json.dumps(de_dot(hit["_source"]))+'\n')
Configuring rsyslog
The first step here is to make sure you have the lastest rsyslog, though the config below works with versions all the way back to 7.x (which can be found in most Linux distributions). You just need to make sure the rsyslog-elasticsearch package is installed, because we need the Elasticsearch output module.
# messages bigger than this are truncated
$maxMessageSize 10000000  # ~10MB

# load the TCP input and the ES output modules
module(load="imtcp")
module(load="omelasticsearch")

main_queue(
  # buffer up to 1M messages in memory
  queue.size="1000000"
  # these threads process messages and send them to Elasticsearch
  queue.workerThreads="4"
  # rsyslog processes messages in batches to avoid queue contention
  # this will also be the Elasticsearch bulk size
  queue.dequeueBatchSize="4000"
)

# we use templates to specify how the data sent to Elasticsearch looks like
template(name="document" type="list"){
  # the "msg" variable contains the document
  property(name="msg")
}
template(name="index" type="list"){
  # "hostname" has the index name
  property(name="hostname")
}
template(name="type" type="list"){
  # "syslogtag" has the type name
  property(name="syslogtag")
}

# start the TCP listener on the port we pointed the Python script to
input(type="imtcp" port="5514")

# sending data to Elasticsearch, using the templates defined earlier
action(type="omelasticsearch"
  template="document"
  dynSearchIndex="on" searchIndex="index"
  dynSearchType="on" searchType="type"
  server="localhost"  # destination Elasticsearch host
  serverport="9200"   # and port
  bulkmode="on"  # use the bulk API
  action.resumeretrycount="-1"  # retry indefinitely if Elasticsearch is unreachable
)
This configuration doesn’t have to disturb your local syslog (i.e. by replacing /etc/rsyslog.conf). You can put it someplace else and run a different rsyslog process:
rsyslogd -i /var/run/rsyslog_reindexer.pid -f /home/me/rsyslog_reindexer.conf
And that’s it! With rsyslog started, you can start the Python script(s) and do the reindexing.
DOWNLOAD OTHER
Apart from installing via tarball or git, RSYSLOG is also available in package form on some distributions. We are currently trying to support a broad range of distributions by using SUSE Open Build Service. We would also appreciate collaborators for this effort.
Almost All Distributions
https://software.opensuse.org//download.html?project=home%3Argerhards&package=rsyslog
The OBS repository is a community-driven resource. It provides packages for many distributions. We plan to have it be to only one in the long term. This small video gives a brief overlook over how to use the OBS repo:
Please accept YouTube cookies to play this video. By accepting you will be accessing content from YouTube, a service provided by an external third party.
If you accept this notice, your choice will be saved and the page will refresh.
All packages currently maintained by Adiscon are listed below. More detailed information about the packages and how to install rsyslog with them can be found at the specific package page. Right now Adiscon provides packages for:
- Ubuntu (http://www.rsyslog.com/ubuntu-repository/)
- RHEL/CentOS (http://www.rsyslog.com/rhelcentos-rpms/) (v8-stable and v8-stable-nightly build packages)
- Debian (http://www.rsyslog.com/debian-repository/)
- Alpine (http://www.rsyslog.com/alpine-repository/).
v8:
| 8.2512.0 | 2025-12-09 Sha256: 93c50025d90b6c795fa350d56a3d832bfce45043ea9bd68240d9c2a9394bc629 File size: 6.768 MB |
| 8.2510.0 | 2025-10-14 Sha256: a70a9834186859539a6a4d1c7b3f68c23897e805829b764a45e92cb0cc95e66a File size: 5.748 MB |
| 8.2508.0 | 2025-09-01 Sha256: c89b1e74d36d0ca4a95b74a1abe36ed0b1faac8b7c8be471a8415cfa776206fd File size: 4.344 MB |
| 8.2506.0 | 2025-06-10 Sha256: 6d6fd0257c95e756765d4d585a833d54dd3a0e5eeb8308b862a81b368a74bb7b File size: 3.484 MB |
| 8.2504.0 | 2025-04-29 Sha256: 5092a20ed40987c74cc604ebfcd6c749e47eb9fc34adc1c2637e6553e7f047ab File size: 3.468 MB |
| 8.2502.0 | 2025-02-18 Sha256: 02fa197d21d519f5a25a928deb9397cd387ba7382b9b449782ba31d8f3118206 File size: 3.470 MB |
| 8.2412.0 | 2024-12-03 Sha256: 8cdfa5a077cba576bdd6b1841cc2848b774e663b2e44a39512bb820174174802 File size: 3.462 MB |
| 8.2410.0 | 2024-10-22 Sha256: b6be03c766df4cde314972c1c01cb74f3eacf8aec57066c0c12be0e079726eba File size: 3.438 MB |
| 8.2408.0 | 2024-08-20 Sha256: 8bb2f15f9bf9bb7e635182e3d3e370bfc39d08bf35a367dce9714e186f787206 File size: 3.436 MB |
| 8.2406.0 | 2024-07-03 Sha256: 1343e0269dd32166ffde04d7ceebfa0e7146cf1dbc6962c56bf428c61f01a7df File size: 3.412 MB |
| 8.2404.0 | 2024-04-02 Sha256: 30528d140ec1b1f079224081fa37df6e06587ff42b02e3e61f2daa0526c54d33 File size: 3.408 MB |
| 8.2402.0 | 2024-02-27 Sha256: acbdd8579489df36b4a383dc6909a61b7623807f0aff54c062115f2de7ea85ba File size: 3.404 MB |
| 8.2312.0 | 2023-12-12 Sha256: 774032006128a896437f5913e132aa27dbfb937cd8847e449522d5a12d63d03e File size: 3.358 MB |
| 8.2310.0 | 2023-10-10 Sha256: 20d9ce792bf0a7ed0703dbf0941490f8be655f48b55b4bebdc0827bbb0ddbf11 File size: 3.349 MB |
| 8.2308.0 | 2023-08-15 Sha256: 02086b9121e872cea69e5d0f6c8e2d8ebff33234b3cad5503665378d3af2e3c9 File size: 3.346 MB |
| 8.2306.0 | 2023-06-20 Sha256: f6283efaadc609540a56e6bec88a362c966e77f29fe48e6b734bd6c1123e0be5 File size: 3.293 MB |
| 8.2304.0 | 2023-04-18 Sha256: d090e90283eb4b80de8b43e5ffc6e4b59c4e3970f2aa91e63beef0a11720d74d File size: 3.274 MB |
| 8.2302.0 | 2023-02-21 Sha256: 25415f85b662615ce3c83077d53758029e8743cb5929044bfd3564e3d626a3b9 File size: 3.273 MB |
| 8.2212.0 | 2022-12-06 Sha256: 53b59a872e3dc7384cdc149abe9744916776f7057d905f3df6722d2eb1b04f35 File size: 3.268 MB |
| 8.2210.0 | 2022-10-18 Sha256: 643ee279139d694a07c9ff3ff10dc5213bdf874983d27d373525e95e05fa094d File size: 3.266 MB |
| 8.2208.0 | 2022-08-09 Sha256: 14de68e7b8e5ab0c5d734f82e2dc9fff22cd7f4710ad690727eb10a7b9b3df5e File size: 3.262 MB |
| 8.2206.0 | 2022-06-14 Sha256: a1377218b26c0767a7a3f67d166d5338af7c24b455d35ec99974e18e6845ba27 File size: 3.246 MB |
| 8.2204.1 | 2022-05-05 Sha256: a6d731e46ad3d64f6ad4b19bbf1bf56ca4760a44a24bb96823189dc2e71f7028 File size: 3.243 MB |
| 8.2204.0 | 2022-04-19 Sha256: 7eb52db775f87f6975b70a5fbff982507c68ba3306ae05ff967443258442245d File size: 3.242 MB |
| 8.2202.0 | 2022-02-15 Sha256: e41308a5a171939b3cbc246e9d4bd30be44e801521e04cd95d051fa3867d6738 File size: 3.234 MB |
| 8.2112.0 | 2021-12-16 Sha256: 6a2a973861e9266db37bd2b7b9f672b6b970bfcd743a397b8eee6b0dc4852c41 File size: 3.230 MB |
| 8.2110.0 | 2021-10-19 Sha256: 3f904ec137ca6412e8273f7896d962ecb589f7d0c589bdf16b1709ec27e24f31 File size: 3.217 MB |
| 8.2108.0 | 2021-08-17 Sha256: 4826c2b6d081a9c95f469fb0115be3f9512065297d3de00ec513758cdb30b1d9 File size: 3.024 MB |
| 8.2106.0 | 2021-06-15 Sha256: faf45c25a2265c001739e8888b3652cf685eb3f35cd65d17d5c38fd44b9ddd81 File size: 3.180 MB |
| 8.2104.0 | 2021-04-20 Sha256: 710981c3c34f88d5d1fb55ecfc042aecad8af69414b2b1602b304f4dedbf9f43 File size: 3.175 MB |
| 8.2102.0 | 2021-02-16 Sha256: 94ee0d0312c2edea737665594cbe4a9475e4e3b593e12b5b8ae3a743ac9c72a7 File size: 3.123 MB |
| 8.2012.0 | 2020-12-08 Sha256: d74cf571e6bcdf8a4c19974afd5e78a05356191390c2f80605a9004d1c587a0e File size: 3.118 MB |
| 8.2010.0 | 2020-10-20 Sha256: 19b232f765c4ba7a35b91ef1f5f9af775f6ff78ef56bb7737a2ce79ccbb32b98 File size: 3.097 MB |
| 8.2008.0 | 2020-08-25 Sha256: 09d2b6c8bc2f016598aed2bb719e03f822bb01d720c61e4d6e725e00dca1b650 File size: 3.051 MB |
| 8.2006.0 | 2020-06-23 Sha256: d9589e64866f2fdc5636af4cae9d60ebf1e3257bb84b81ee953ede6a05878e97 File size: 3.047 MB |
| 8.2004.0 | 2020-04-28 Sha256: 5fc3d7b775f0879a40606d960491812a602e22f62e006ce027ed7bcf4c9f27d9 File size: 3.002 MB |
| 8.2002.0 | 2020-02-25 Sha256: fe86c14d860da1202c76616feac0539ea5a40a4ad182d74b7d6d2419cc2381f8 File size: 3.001 MB |
| 8.2001.0 | 2020-01-14 Sha256: 58bf06f58cd4a4d796bc5aea65fffc18c25619285adaa90d89d4cea5921ea8da File size: 2.999 MB |
| 8.1911.0 | 2019-11-12 Sha256: e1f4776b1c62ad7220f4d624a89a96b0c3d4738006899356eaaef0f1f91ee104 File size: 2.967 MB |
| 8.1910.0 | 2019-10-01 Sha256: 0219ee692f31a39743acb62aaf4196b644ce94edf386df4605fd6a11a4fe0c93 File size: 2.957 MB |
| 8.1908.0 | 2019-08-20 Sha256: f8c8e53b651e03a011667c60bd2d4dba7a7cb6ec04b247c8ea8514115527863b File size: 2.952 MB |
| 8.1907.0 | 2019-07-09 Sha256: eb27535ece93174ef6b551c88467d2c9cd826b62479625bb881a53d50b079fb5 File size: 2.926 MB |
| 8.1905.0 | 2019-05-28 Sha256: 96bd4fab8d768fd6ad22d45e10b83e159b93df9bafcde1d582e1224f647116e4 File size: 2.911 MB |
| 8.1904.0 | 2019-04-16 Sha256: 7098b459dfc3f8bfc35d5b114c56e7945614ba76efa4e513b1db9c38b0ff9c3d File size: 2.903 MB |
| 8.1903.0 | 2019-03-05 Sha256: d0d23a493dcec64c7b6807a1bb8ee864ed0f3760c2ff3088008bb661d304056f File size: 2.786 MB |
| 8.1901.0 | 2019-01-22 Sha256: ab02c1f11e21b54cfaa68797f083d6f73d9d72ce7a1c04037fbe0d4cee6f27c4 File size: 2.750 MB |
| 8.40.0 | 2018-12-11 Sha256: 414abbdd27b65d3cd513e1a8a7ccbd110d06160759189e818ea93aca962fc194 File size: 2.726 MB |
| 8.39.0 | 2018-10-30 Sha256: c71f96fed6538de397df25da602384f6ee2cb67329d9f3362af2a18508616ab4 File size: 2.721 MB |
| 8.38.0 | 2018-09-18 Sha256: 4d328ed3bcae784e15401c6c20ada2a9be380798ff6bf0da3fe2095915bba22c File size: 2.721 MB |
| 8.37.0 | 2018-08-07 Sha256: 295c289b4c8abd8f8f3fe35a83249b739cedabe82721702b910255f9faf147e7 File size: 2.697 MB |
| 8.36.0 | 2018-06-26 Sha256: 8a4b5beb92c6b308c3d14de2364c2788f62ef5d37ca0448144619edfe508ee70 File size: 2.639 MB |
| 8.35.0 | 2018-05-15 Sha256: d216a7f7c88341d5964657e61a33193c13d884c988822fced9fce3ab0b1f1082 File size: 2.590 MB |
| 8.34.0 | 2018-04-03 Sha256: 18330a9764c55d2501b847aad267292bd96c2b12fa5c3b92909bd8d4563c80a9 File size: 2.545 MB |
| 8.33.1 | 2018-03-06 Sha256: 2da2bd773dbd5fde4eb162d5411dac96bf596b33e62a4062610443686597e3a8 File size: 2.494 MB |
| 8.32.0 | 2018-01-09 Sha256: 9646fdc33a6314464cba68323716010a8a55c3deb523cd798ba8b41a0efa40b8 File size: 2.478 MB |
| 8.31.0 | 2017-11-28 Sha256: eee6318f8127f56500c1e1f672fac6207eeb87bbf0985f5af964f881a96601b2 File size: 2.498 MB |
| 8.30.0 | 2017-10-17 Sha256: dfb9c3efe52ad03ad9f4479699139fb447177049553b6993315f53b668a2251f File size: 2.468 MB |
| 8.29.0 | 2017-08-08 Sha256: 220ba30b5afb0f3ddb328613fea7aa3966b01e4d0c52d6de9ab27b0858f19738 File size: 2.447 MB |
| 8.28.0 | 2017-06-27 Sha256: 4ca5405908d612d45da700e36856430510875518eb8028d296d1ee4d2c44678e File size: 2.435 MB |
| 8.27.0 | 2017-05-16 Sha256: 02aefbba59324a6d8b70036a67686bed5f0c7be4ced62c039af6ee694cb5b1fd File size: 2.435 MB |
| 8.26.0 | 2017-04-04 Sha256: 637d43c4384f8b96dda873a0b8384045f72cb43139808dadd9e0a94dccf25916 File size: 2.393 MB |
| 8.25.0 | 2017-02-21 Sha256: c756f16a083e5d4081fb9bfb236303a839cdca0a2c00017bd770b2e2e9677427 File size: 2.386 MB |
| 8.24.0 | 2017-01-10 Sha256: 37f32ce33e32a88e1bea0511e8e557d90b7378b81520e3236a9af5ba6ea993d7 File size: 2.374 MB |
| 8.23.0 | 2016-11-15 Sha256: 244e79552d37a5729f3f53786062828adc16fd080eeb0de6507bff55ed21693b File size: 2.284 MB |
| 8.22.0 | 2016-10-05 Sha256: 06e2884181333dccecceaca82827ae24ca7a258b4fbf7b1e07a80d4caae640ca File size: 2.207 MB |
| 8.21.0 | 2016-08-23 Sha256: bdb1fde87b75107b58d1cd5d00408822fb15b9f3efb8d9dbb93a1dee128339ab File size: 2.23 MB |
| 8.20.0 | 2016-07-12 Sha256: 339c8f848238459318bf742d1c7a48854f98418fd3a7909030b614c395165b17 File size: 2.23 MB |
| 8.19.0 | 2016-05-31 Sha256: 3379b30f2e6ef05a0f1c7327c73923fa5877a80b984506cdf48ed068c94a575 File size: 2.23 MB |
| 8.18.0 | 2016-04-19 Sha256: 94346237ecfa22c9f78cebc3f18d59056f5d9846eb906c75beaa7e486f02c695 File size: 2.21 MB |
| 8.17.0 | 2016-03-08 Sha256: ec1e19b5964cf88a9c0508d438248244b71ca35967fe40b842938f4ce9ba5fb9 File size: 2.08 MB |
| 8.16.0 | 2016-01-26 Sha256: 4fe4f97c10899086d98b9401d7e8d2bcff61c7c3f7cde8627891e36fc6ec1b76 File size: 2.08 MB |
| 8.15.0 | 2015-12-16 Sha256: 9ed6615a8503964290471e98ed363f3975b964a34c2d4610fb815a432aadaf59 File size: 2.06 MB |
| 8.14.0 | 2015-11-05 Sha256: 443b5b1d2b84f5cd429d06d230af7fb2352336fa6449cb6484dbd4418a7ae7c2 File size: 2.08 MB |
| 8.13.0 | 2015-09-22 Sha256: b182bd0a7686bef093be570bfb850417191292522fb58e0ad32f2c824f754a33 File size: 2.08 MB |
| 8.12.0 | 2015-08-11 Sha256: 466bfeac8296e89de1eb9029880998ba7b5fc25694143197bb47167df6cb7e20 File size: 2.04 MB |
| 8.11.0 | 2015-06-30 Sha256: bc64d8ba1e3fb8cfe21eadd5fb0938381bb37ed72cef9d6f14d376d2bac9bf78 File size: 2.01 MB |
| 8.10.0 | 2015-05-19 Sha256: b92df3f367108219e2fffccd463bf49d75cb8ab3ceaa52e9789f85eace066912 File size: 2.01 MB |
| 8.9.0 | 2015-04-07 Sha256: eab00e8e758cd9dd33b3e2cf6af80297d1951dc7db37bd723a6488a35d577adc File size: 2.02 MB |
| 8.8.0 | 2015-02-24 Sha256: 147a7e474665af7a817ac18d7924e26448350a77572e7fd9cfe284cb6291a0eb File size: 2.00 MB |
| 8.7.0 | 2015-01-13 Sha256: c77125b67a623569c9bdca8136b9aac013f1c6fd82fb8595e3ea267e61800f9c File size: 2.00 MB |
| 8.6.0 | 2014-12-02 Sha256: 759f836be460c794a7649f2b5b5ef8d423388ec599bf3b49f51fded3f8c02431 File size: 1.97 MB |
| 8.5.0 | 2014-10-24 Sha256: 0d20144be8a5d107a172418b1a39cdd48d7ef921b94e7ea45c58b12bce8caa52 File size: 1.98 MB |
| 8.4.2 | 2014-10-02 Sha256: 71c3c6dac74fba2692f9fefb092cd3d22e2bd71eb702 |
Connecting with Logstash via Apache Kafka
Original post: Recipe: rsyslog + Kafka + Logstash by @Sematext
This recipe is similar to the previous rsyslog + Redis + Logstash one, except that we’ll use Kafka as a central buffer and connecting point instead of Redis. You’ll have more of the same advantages:
- rsyslog is light and crazy-fast, including when you want it to tail files and parse unstructured data (see the Apache logs + rsyslog + Elasticsearch recipe)
- Kafka is awesome at buffering things
- Logstash can transform your logs and connect them to N destinations with unmatched ease
There are a couple of differences to the Redis recipe, though:
- rsyslog already has Kafka output packages, so it’s easier to set up
- Kafka has a different set of features than Redis (trying to avoid flame wars here) when it comes to queues and scaling
As with the other recipes, I’ll show you how to install and configure the needed components. The end result would be that local syslog (and tailed files, if you want to tail them) will end up in Elasticsearch, or a logging SaaS like Logsene (which exposes the Elasticsearch API for both indexing and searching). Of course you can choose to change your rsyslog configuration to parse logs as well (as we’ve shown before), and change Logstash to do other things (like adding GeoIP info).
Getting the ingredients
First of all, you’ll probably need to update rsyslog. Most distros come with ancient versions and don’t have the plugins you need. From the official packages you can install:
- rsyslog. This will update the base package, including the file-tailing module
- rsyslog-kafka. This will get you the Kafka output module
If you don’t have Kafka already, you can set it up by downloading the binary tar. And then you can follow the quickstart guide. Basically you’ll have to start Zookeeper first (assuming you don’t have one already that you’d want to re-use):
bin/zookeeper-server-start.sh config/zookeeper.properties
And then start Kafka itself and create a simple 1-partition topic that we’ll use for pushing logs from rsyslog to Logstash. Let’s call it rsyslog_logstash:
bin/kafka-server-start.sh config/server.properties
bin/kafka-topics.sh --create --zookeeper localhost:2181 --replication-factor 1 --partitions 1 --topic rsyslog_logstash
Finally, you’ll have Logstash. At the time of writing this, we have a beta of 2.0, which comes with lots of improvements (including huge performance gains of the GeoIP filter I touched on earlier). After downloading and unpacking, you can start it via:
bin/logstash -f logstash.conf
Though you also have packages, in which case you’d put the configuration file in /etc/logstash/conf.d/ and start it with the init script.
Configuring rsyslog
With rsyslog, you’d need to load the needed modules first:
module(load="imuxsock")  # will listen to your local syslog
module(load="imfile")    # if you want to tail files
module(load="omkafka")   # lets you send to Kafka
If you want to tail files, you’d have to add definitions for each group of files like this:
input(type="imfile"
  File="/opt/logs/example*.log"
  Tag="examplelogs"
)
Then you’d need a template that will build JSON documents out of your logs. You would publish these JSON’s to Kafka and consume them with Logstash. Here’s one that works well for plain syslog and tailed files that aren’t parsed via mmnormalize:
template(name="json_lines" type="list" option.json="on") {
  constant(value="{")
  constant(value="\"timestamp\":\"")
  property(name="timereported" dateFormat="rfc3339")
  constant(value="\",\"message\":\"")
  property(name="msg")
  constant(value="\",\"host\":\"")
  property(name="hostname")
  constant(value="\",\"severity\":\"")
  property(name="syslogseverity-text")
  constant(value="\",\"facility\":\"")
  property(name="syslogfacility-text")
  constant(value="\",\"syslog-tag\":\"")
  property(name="syslogtag")
  constant(value="\"}")
}
By default, rsyslog has a memory queue of 10K messages and has a single thread that works with batches of up to 16 messages (you can find all queue parameters here). You may want to change:
– the batch size, which also controls the maximum number of messages to be sent to Kafka at once
– the number of threads, which would parallelize sending to Kafka as well
– the size of the queue and its nature: in-memory(default), disk or disk-assisted
In a rsyslog->Kafka->Logstash setup I assume you want to keep rsyslog light, so these numbers would be small, like:
main_queue(
  queue.workerthreads="1"      # threads to work on the queue
  queue.dequeueBatchSize="100" # max number of messages to process at once
  queue.size="10000"           # max queue size
)
Finally, to publish to Kafka you’d mainly specify the brokers to connect to (in this example we have one listening to localhost:9092) and the name of the topic we just created:
action(
  broker=["localhost:9092"]
  type="omkafka"
  topic="rsyslog_logstash"
  template="json"
)
Assuming Kafka is started, rsyslog will keep pushing to it.
Configuring Logstash
This is the part where we pick the JSON logs (as defined in the earlier template) and forward them to the preferred destinations. First, we have the input, which will use to the Kafka topic we created. To connect, we’ll point Logstash to Zookeeper, and it will fetch all the info about Kafka from there:
input {
  kafka {
    zk_connect => "localhost:2181"
    topic_id => "rsyslog_logstash"
  }
}
At this point, you may want to use various filters to change your logs before pushing to Logsene/Elasticsearch. For this last step, you’d use the Elasticsearch output:
output {
  elasticsearch {
    hosts => "localhost" # it used to be "host" pre-2.0
    port => 9200
    #ssl => "true"
    #protocol => "http" # removed in 2.0
  }
}
And that’s it! Now you can use Kibana (or, in the case of Logsene, either Kibana or Logsene’s own UI) to search your logs!
Recipe: Apache Logs + rsyslog (parsing) + Elasticsearch
Original post: Recipe: Apache Logs + rsyslog (parsing) + Elasticsearch by @Sematext
This recipe is about tailing Apache HTTPD logs with rsyslog, parsing them into structured JSON documents, and forwarding them to Elasticsearch (or a log analytics SaaS, like Logsene, which exposes the Elasticsearch API). Having them indexed in a structured way will allow you to do better analytics with tools like Kibana:

We’ll also cover pushing logs coming from the syslog socket and kernel, and how to buffer all of them properly. So this is quite a complete recipe for your centralized logging needs.
Getting the ingredients
Even though most distros already have rsyslog installed, it’s highly recommended to get the latest stable from the rsyslog repositories. The packages you’ll need are:
- rsyslog. The base package, including the file-tailing module (imfile)
- rsyslog-mmnormalize. This gives you mmnormalize, a module that will do the parsing of common Apache logs to JSON
- rsyslog-elasticsearch, for the Elasticsearch output
With the ingredients in place, let’s start cooking a configuration. The configuration needs to do the following:
- load the required modules
- configure inputs: tailing Apache logs and system logs
- configure the main queue to buffer your messages. This is also the place to define the number of worker threads and batch sizes (which will also be Elasticsearch bulk sizes)
- parse common Apache logs into JSON
- define a template where you’d specify how JSON messages would look like. You’d use this template to send logs to Logsene/Elasticsearch via the Elasticsearch output
Loading modules
Here, we’ll need imfile to tail files, mmnormalize to parse them, and omelasticsearch to send them. If you want to tail the system logs, you’d also need to include imuxsock and imklog (for kernel logs).
# system logs
module(load="imuxsock")
module(load="imklog")
# file
module(load="imfile")
# parser
module(load="mmnormalize")
# sender
module(load="omelasticsearch")
Configure inputs
For system logs, you typically don’t need any special configuration (unless you want to listen to a non-default Unix Socket). For Apache logs, you’d point to the file(s) you want to monitor. You can use wildcards for file names as well. You also need to specify a syslog tag for each input. You can use this tag later for filtering.
input(type="imfile"
      File="/var/log/apache*.log"
      Tag="apache:"
)NOTE: By default, rsyslog will not poll for file changes every N seconds. Instead, it will rely on the kernel (via inotify) to poke it when files get changed. This makes the process quite realtime and scales well, especially if you have many files changing rarely. Inotify is also less prone to bugs when it comes to file rotation and other events that would otherwise happen between two “polls”. You can still use the legacy mode=”polling” by specifying it in imfile’s module parameters.
Queue and workers
By default, all incoming messages go into a main queue. You can also separate flows (e.g. files and system logs) by using different rulesets but let’s keep it simple for now.
For tailing files, this kind of queue would work well:
main_queue(
  queue.workerThreads="4"
  queue.dequeueBatchSize="1000"
  queue.size="10000"
)
This would be a small in-memory queue of 10K messages, which works well if Elasticsearch goes down, because the data is still in the file and rsyslog can stop tailing when the queue becomes full, and then resume tailing. 4 worker threads will pick batches of up to 1000 messages from the queue, parse them (see below) and send the resulting JSONs to Elasticsearch.
If you need a larger queue (e.g. if you have lots of system logs and want to make sure they’re not lost), I would recommend using a disk-assisted memory queue, that will spill to disk whenever it uses too much memory:
main_queue(
  queue.workerThreads="4"
  queue.dequeueBatchSize="1000"
  queue.highWatermark="500000"    # max no. of events to hold in memory
  queue.lowWatermark="200000"     # use memory queue again, when it's back to this level
  queue.spoolDirectory="/var/run/rsyslog/queues"  # where to write on disk
  queue.fileName="stats_ruleset"
  queue.maxDiskSpace="5g"        # it will stop at this much disk space
  queue.size="5000000"           # or this many messages
  queue.saveOnShutdown="on"      # save memory queue contents to disk when rsyslog is exiting
)
Parsing with mmnormalize
The message normalization module uses liblognorm to do the parsing. So in the configuration you’d simply point rsyslog to the liblognorm rulebase:
action(type="mmnormalize"
  rulebase="/opt/rsyslog/apache.rb"
)
where apache.rb will contain rules for parsing apache logs, that can look like this:
version=2

rule=:%clientip:word% %ident:word% %auth:word% [%timestamp:char-to:]%] "%verb:word% %request:word% HTTP/%httpversion:float%" %response:number% %bytes:number% "%referrer:char-to:"%" "%agent:char-to:"%"%blob:rest%
Where version=2 indicates that rsyslog should use liblognorm’s v2 engine (which is was introduced in rsyslog 8.13) and then you have the actual rule for parsing logs. You can find more details about configuring those rules in the liblognorm documentation.
Besides parsing Apache logs, creating new rules typically requires a lot of trial and error. To check your rules without messing with rsyslog, you can use the lognormalizer binary like:
head -1 /path/to/log.file | /usr/lib/lognorm/lognormalizer -r /path/to/rulebase.rb -e json
NOTE: If you’re used to Logstash’s grok, this kind of parsing rules will look very familiar. However, things are quite different under the hood. Grok is a nice abstraction over regular expressions, while liblognorm builds parse trees out of specialized parsers. This makes liblognorm much faster, especially as you add more rules. In fact, it scales so well, that for all practical purposes, performance depends on the length of the log lines and not on the number of rules. This post explains the theory behind this assuption, and this is actually proven by various tests. The downside is that you’ll lose some of the flexibility offered by regular expressions. You can still use regular expressions with liblognorm (you’d need to set allow_regex to on when loading mmnormalize) but then you’d lose a lot of the benefits that come with the parse tree approach.
Template for parsed logs
Since we want to push logs to Elasticsearch as JSON, we’d need to use templates to format them. For Apache logs, by the time parsing ended, you already have all the relevant fields in the $!all-json variable, that you’ll use as a template:
template(name="all-json" type="list"){
  property(name="$!all-json")
}
Template for time-based indices
For the logging use-case, you’d probably want to use time-based indices (e.g. if you keep your logs for 7 days, you can have one index per day). Such a design will give your cluster a lot more capacity due to the way Elasticsearch merges data in the background (you can learn the details in our presentations at GeeCON and Berlin Buzzwords).
To make rsyslog use daily or other time-based indices, you need to define a template that builds an index name off the timestamp of each log. This is one that names them logstash-YYYY.MM.DD, like Logstash does by default:
template(name="logstash-index"
  type="list") {
    constant(value="logstash-")
    property(name="timereported" dateFormat="rfc3339" position.from="1" position.to="4")
    constant(value=".")
    property(name="timereported" dateFormat="rfc3339" position.from="6" position.to="7")
    constant(value=".")
    property(name="timereported" dateFormat="rfc3339" position.from="9" position.to="10")
}
And then you’d use this template in the Elasticsearch output:
action(type="omelasticsearch"
  template="all-json"
  dynSearchIndex="on"
  searchIndex="logstash-index"
  searchType="apache"
  server="MY-ELASTICSEARCH-SERVER"
  bulkmode="on"
  action.resumeretrycount="-1"
)
Putting both Apache and system logs together
If you use the same rsyslog to parse system logs, mmnormalize won’t parse them (because they don’t match Apache’s common log format). In this case, you’ll need to pick the rsyslog properties you want and build an additional JSON template:
template(name="plain-syslog"
  type="list") {
    constant(value="{")
      constant(value="\"timestamp\":\"")     property(name="timereported" dateFormat="rfc3339")
      constant(value="\",\"host\":\"")        property(name="hostname")
      constant(value="\",\"severity\":\"")    property(name="syslogseverity-text")
      constant(value="\",\"facility\":\"")    property(name="syslogfacility-text")
      constant(value="\",\"tag\":\"")   property(name="syslogtag" format="json")
      constant(value="\",\"message\":\"")    property(name="msg" format="json")
    constant(value="\"}")
}
Then you can make rsyslog decide: if a log was parsed successfully, use the all-json template. If not, use the plain-syslog one:
if $parsesuccess == "OK" then {
 action(type="omelasticsearch"
  template="all-json"
  ...
 )
} else {
 action(type="omelasticsearch"
  template="plain-syslog"
  ...
 )
}
And that’s it! Now you can restart rsyslog and get both your system and Apache logs parsed, buffered and indexed into Elasticsearch. If you’re a Logsene user, the recipe is a bit simpler: you’d follow the same steps, except that you’ll skip the logstash-index template (Logsene does that for you) and your Elasticsearch actions will look like this:
action(type="omelasticsearch"
  template="all-json or plain-syslog"
  searchIndex="LOGSENE-APP-TOKEN-GOES-HERE"
  searchType="apache"
  server="logsene-receiver.sematext.com"
  serverport="80"
  bulkmode="on"
  action.resumeretrycount="-1"
)
Coupling with Logstash via Redis
Original post: Recipe: rsyslog + Redis + Logstash by @Sematext
OK, so you want to hook up rsyslog with Logstash. If you don’t remember why you want that, let me give you a few hints:
- Logstash can do lots of things, it’s easy to set up but tends to be too heavy to put on every server
- you have Redis already installed so you can use it as a centralized queue. If you don’t have it yet, it’s worth a try because it’s very light for this kind of workload.
- you have rsyslog on pretty much all your Linux boxes. It’s light and surprisingly capable, so why not make it push to Redis in order to hook it up with Logstash?
In this post, you’ll see how to install and configure the needed components so you can send your local syslog (or tail files with rsyslog) to be buffered in Redis so you can use Logstash to ship them to Elasticsearch, a logging SaaS like Logsene (which exposes the Elasticsearch API for both indexing and searching) so you can search and analyze them with Kibana:

RSyslog Windows Agent 3.1 Released
Adiscon is proud to announce the 3.1 release of RSyslog Windows Agent.
This is a maintenenance release for RSyslog Windows Agent. It includes some bugfixes as well as a new rule date condition which can be used to process events starting from a certain date. A few new options have been added into the Syslog Service as well.
Detailed information can be found in the version history below.
Build-IDs: Service 3.1.0.134, Client 3.1.0.213
Features |
|
Bugfixes |
|
Version 3.1 is a free download. Customers with existing 2.x keys can contact our Sales department for upgrade prices. If you have a valid Upgrade Insurance ID, you can request a free new key by sending your Upgrade Insurance ID to sales@adiscon.com. Please note that the download enables the free 30-day trial version if used without a key – so you can right now go ahead and evaluate it.
Tutorial: Sending impstats Metrics to Elasticsearch Using Rulesets and Queues
Originally posted on the Sematext blog: Monitoring rsyslog’s Performance with impstats and Elasticsearch
If you’re using rsyslog for processing lots of logs (and, as we’ve shown before, rsyslog is good at processing lots of logs), you’re probably interested in monitoring it. To do that, you can use impstats, which comes from input module for process stats. impstats produces information like:
– input stats, like how many events went through each input
– queue stats, like the maximum size of a queue
– action (output or message modification) stats, like how many events were forwarded by each action
– general stats, like CPU time or memory usage
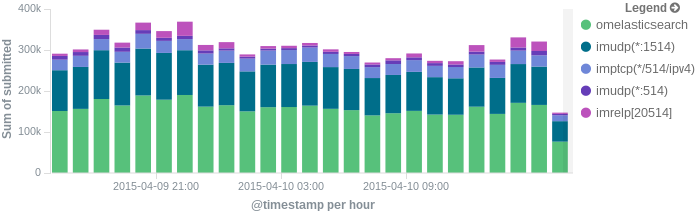
In this post, we’ll show you how to send those stats to Elasticsearch (or Logsene — essentially hosted ELK, our log analytics service, that exposes the Elasticsearch API), where you can explore them with a nice UI, like Kibana. For example get the number of logs going through each input/output per hour:
More precisely, we’ll look at:
– useful options around impstats
– how to use those stats and what they’re about
– how to ship stats to Elasticsearch/Logsene by using rsyslog’s Elasticsearch output
– how to do this shipping in a fast and reliable way. This will apply to most rsyslog use-cases, not only impstats
Continue reading “Tutorial: Sending impstats Metrics to Elasticsearch Using Rulesets and Queues”
RSyslog Windows Agent 3.0 Released
Adiscon is proud to announce the 3.0 release of RSyslog Windows Agent.
This new major release adds full support for Windows 2012 R2 and also has been verified to work on Windows 10 preview versions.
The new major version is a milestone in many ways. Most important the performance of the core engine has been considerably increased. All existing configurations will benefit from this. Also a new Configuration Client has been added which has been rewritten using the .Net Framework (Like the InterActive Syslog Viewer). With the new Configuration Client, we also introduce support for a new file based configuration format (as an alternative to the registry-based method). RSyslog Windows Agent can now run from a configuration file and save it state values
into files.
We also extended the classic EventLog Monitor to support multiple dynamic *.evt files for NetApp customers.
Detailed information can be found in the version history below.
Build-IDs: Service 3.0.130, Client 3.0.201
Features |
|
Bugfixes |
|
Version 3.0 is a free download. Customers with existing 2.x keys can contact our Sales department for upgrade prices. If you have a valid Upgrade Insurance ID, you can request a free new key by sending your Upgrade Insurance ID to sales@adiscon.com. Please note that the download enables the free 30-day trial version if used without a key – so you can right now go ahead and evaluate it.
Daily Stable Build
As of our policy, the git master branch is kept stable. In other words: when it comes time to craft a scheduled stable release (every 6 weeks), we grab the master branch as-is and use it to build the release. We currently provide daily stable versions for Ubuntu only (helping hands for other platforms would be appreciated). To obtain them visit
Ubuntu repository installation instructions
Note: you must replace “v8-stable” in these instructions with “v8-devel”. The name “v8-devel” is used for historic reasons. It will probably be changed soon to better reflect that this actually is stable code.
Using the stable daily build has some advantages over the scheduled one:
- you receive the latest bug fixes, including those for known issues in the scheduled stable release
- you get hold of the latest feature updates; note that some experimental features not fully matured may be included (this also happens, a bit later, with the scheduled stable release)
- a real plus over the scheduled release is that if we actually introduced a bug, it will possibly much quicker be fixed compared to the same bug when it made its way into the scheduled release.
You do not need to be concerned that you break configurations by using the daily stable. As of our policies, we never make changes that break existing configs. The only exception from this rule is if there is an extremely good reason for doing so. If so, the same breaking change will be propagated at most 6 weeks later into the scheduled stable release.
In short: there are many good reasons to use the daily stable builds. Please do so. The community fully supports them.
Version Numbering
Daily stable build version numbering is a bit different than usual. Daily builds will identify themselves like this: rsyslogd 8.1907.0.35e7f12a2c04. We simply add the 12 digit commit hash to the version string used for the scheduled version. Also, daily build are always one version ahead of the scheduled version – because that is what they will later be known as.