Tutorial: Sending impstats Metrics to Elasticsearch Using Rulesets and Queues
Originally posted on the Sematext blog: Monitoring rsyslog’s Performance with impstats and Elasticsearch
If you’re using rsyslog for processing lots of logs (and, as we’ve shown before, rsyslog is good at processing lots of logs), you’re probably interested in monitoring it. To do that, you can use impstats, which comes from input module for process stats. impstats produces information like:
– input stats, like how many events went through each input
– queue stats, like the maximum size of a queue
– action (output or message modification) stats, like how many events were forwarded by each action
– general stats, like CPU time or memory usage
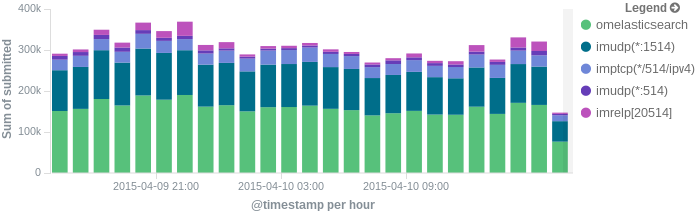
In this post, we’ll show you how to send those stats to Elasticsearch (or Logsene — essentially hosted ELK, our log analytics service, that exposes the Elasticsearch API), where you can explore them with a nice UI, like Kibana. For example get the number of logs going through each input/output per hour:
More precisely, we’ll look at:
– useful options around impstats
– how to use those stats and what they’re about
– how to ship stats to Elasticsearch/Logsene by using rsyslog’s Elasticsearch output
– how to do this shipping in a fast and reliable way. This will apply to most rsyslog use-cases, not only impstats
Continue reading “Tutorial: Sending impstats Metrics to Elasticsearch Using Rulesets and Queues”
Using rsyslog and Elasticsearch to Handle Different Types of JSON Logs
Originally posted on the Sematext blog: Using Elasticsearch Mapping Types to Handle Different JSON Logs
By default, Elasticsearch does a good job of figuring the type of data in each field of your logs. But if you like your logs structured like we do, you probably want more control over how they’re indexed: is time_elapsed an integer or a float? Do you want your tags analyzed so you can search for big in big data? Or do you need it not_analyzed, so you can show top tags via the terms aggregation? Or maybe both?
In this post, we’ll look at how to use index templates to manage multiple types of logs across multiple indices. Also, we’ll explain how to use rsyslog to handle JSON logging and specify types.
Elasticsearch Mapping and Logs
To control settings for how a field is analyzed in Elasticsearch, you’ll need to define a mapping. This works similarly in Logsene, our log analytics SaaS, because it uses Elasticsearch and exposes its API.
With logs you’ll probably use time-based indices, because they scale better (in Logsene, for instance, you get daily indices). To make sure the mapping you define today applies to the index you create tomorrow, you need to define it in an index template.
Managing Multiple Types
Mappings provide a nice abstraction when you have to deal with multiple types of structured data. Let’s say you have two apps generating logs of different structures: both have a timestamp field, but one recording logins has a user field, and another one recording purchases has an amount field.
To deal with this, you can define the timestamp field in the _default_ mapping which applies to all types. Then, in each type’s own mapping we’ll define fields unique to that mapping. The following snippet is an example that works with Logsene, provided that aaaaaaaa-bbbb-cccc-dddd-eeeeeeeeeeee is your Logsene app token. If you roll your own Elasticsearch, you can use whichever name you want, and make sure the template name applies to matches index pattern (for example, logs-* will work if your indices are in the logs-YYYY-MM-dd format).
curl -XPUT 'logsene-receiver.sematext.com/_template/aaaaaaaa-bbbb-cccc-dddd-eeeeeeeeeeee_MyTemplate' -d '{
 "template" : "aaaaaaaa-bbbb-cccc-dddd-eeeeeeeeeeee*",
 "order" : 21,
 "mappings" : {
  "_default_" : {
   "properties" : {
    "timestamp" : { "type" : "date" }
   }
  },
  "firstapp" : {
   "properties" : {
    "user" : { "type" : "string" }
   }
  },
  "secondapp" : {
   "properties" : {
    "amount" : { "type" : "long" }
   }
  }
 }
}'
Sending JSON Logs to Specific Types
When you send a document to Elasticsearch by using the API, you have to provide an index and a type. You can use an Elasticsearch client for your preferred language to log directly to Elasticsearch or Logsene this way. But I wouldn’t recommend this, because then you’d have to manage things like buffering if the destination is unreachable.
Instead, I’d keep my logging simple and use a specialized logging tool, such as rsyslog, to do the hard work for me. Logging to a file is usually the easiest option. It’s local, and you can have your logging tool tail the file and send contents over the network. I usually prefer sockets (like syslog) because they let me configure rsyslog to:
– write events in a human format to a local file I can tail if I need to (usually in development)
– forward logs without hitting disk if I need to (usually in production)
Whatever you prefer, I think writing to local files or sockets is better than sending logs over the network from your application. Unless you’re willing to do a reliability trade-off and use UDP, which gets rid of most complexities.
Opinions aside, if you want to send JSON over syslog, there’s the JSON-over-syslog (CEE) format that we detailed in a previous post. You can use rsyslog’s JSON parser module to take your structured logs and forward them to Logsene:
module(load="imuxsock")        # can listen to local syslog socket
module(load="omelasticsearch") # can forward to Elasticsearch
module(load="mmjsonparse")     # can parse JSON

action(type="mmjsonparse")  # parse CEE-formatted messages

template(name="syslog-cee" type="list") {  # Elasticsearch documents will contain
  property(name="$!all-json")              # all JSON fields that were parsed
}

action(
  type="omelasticsearch"
  template="syslog-cee"                     # use the template defined earlier
  server="logsene-receiver.sematext.com"
  serverport="80"
  searchType="syslogapp"
  searchIndex="LOGSENE-APP-TOKEN-GOES-HERE"
  bulkmode="on"                                # send logs in batches
  queue.dequeuebatchsize="1000"                # of up to 1000
  action.resumeretrycount="-1"    # retry indefinitely (buffer) if destination is unreachable
)
To send a CEE-formatted syslog, you can run logger ‘@cee: {“amount”: 50}’ for example. Rsyslog would forward this JSON to Elasticsearch or Logsene via HTTP. Note that Logsene also supports CEE-formatted JSON over syslog out of the box if you want to use a syslog protocol instead of the Elasticsearch API.
Filtering by Type
Once your logs are in, you can filter them by type (via the _type field) in Kibana:

However, if you want more refined filtering by source, we suggest using a separate field for storing the application name. This can be useful when you have different applications using the same logging format. For example, both crond and postfix use plain syslog.
rsyslog 8.2.0 (v8-stable) released
http://www.rsyslog.com/changelog-for-8-2-0-v8-stable/
Download:
http://www.rsyslog.com/downloads/download-v8-stable/
As always, feedback is appreciated.
Best regards,
Florian Riedl
Changelog for 8.2.0 (v8-stable)
Version 8.2.0 [v8-stable] 2014-04-02
This starts a new stable branch based on 8.1.6 plus the following changes:
- we now use doc from the rsyslog-doc project
As such, the ./doc subtree has been removed. Instead, a cache of the rsyslog-doc project’s files has been included in ./rsyslog-doc.tar.gz. Note that the exact distribution mode for the doc is still under discussion and may change in future releases. This was agreed upon on the rsyslog mailing list. For doc issues and corrections, be sure to work with the rsyslog-doc project. It is currently hosted at https://github.com/rsyslog/rsyslog-doc - add support for specifying the liblogging-stdlog channel spec
new global parameter “stdlog.channelspec” - add “
defaultnetstreamdrivercertfile” global variable to set a default for the certfile.
Thanks to Radu Gheorghe for the patch. - omelasticsearch: add new “usehttps” parameter for secured connections
Thanks to Radu Gheorghe for the patch. - “action resumed” message now also specifies module type which makes troubleshooting a bit easier. Note that we cannot output all the config details (like destination etc) as this would require much more elaborate code changes, which we at least do not like to do in the stable version.
- add capability to override GnuTLS path in build process
Thanks to Clayton Shotwell for the patch - better and more consistent action naming, action queues now always contain the word “queue” after the action name
- bugfix: ompipe did resume itself even when it was still in error
See: https://github.com/rsyslog/rsyslog/issues/35
Thanks to github user schplat for reporting
Performance Tuning&Tests for the Elasticsearch Output
Original post: Rsyslog 8.1 Elasticsearch Output Performance by @Sematext
Version 8 brings major changes in rsyslog’s core – see Rainer’s presentation about it for more details. Those changes should give outputs better performance, and the Elasticsearch one should benefit a lot. Since we’re using rsyslog and Elasticsearch in Sematext‘s own log analytics product, Logsene, we had to take the new version for a spin.
The Weapon and the Target
For testing, we used a good-old i3 laptop, with 8GB of RAM. We generated 20 million logs, sent them to rsyslog via TCP and from there to Elasticsearch in the Logstash format, so they can get explored with Kibana. The objective was to stuff as many events per second into Elasticsearch as possible.
Rsyslog Architecture Overview
In order to tweak rsyslog effectively, one needs to understand its architecture, which is not that obvious (although there’s an ongoing effort to improve the documentation). The gist of it its architecture represented in the figure below.
- you have input modules taking messages (from files, TCP/UDP, journal, etc.) and pushing them to a main queue
- one or more main queue threads take those events and parse them. By default, they parse syslog formats (RFC-3164, RFC-5424 and various derivatives), but you can configure rsyslog to use message modifier modules to do additional parsing (e.g. CEE-formatted JSON messages). Either way, this parsing generates structured events, made out of properties
- after parsing, the main queue threads push events to the action queue. Or queues, if there are multiple actions and you want to fan-out
- for each defined action, one or more action queue threads takes properties from events according to templates, and makes messages that would be sent to the destination. In Elasticsearch’s case, a template should make Elasticsearch JSON documents, and the destination would be the REST API endpoint

There are two more things to say about rsyslog’s architecture before we move on to the actual test:
- you can have multiple independent flows (like the one in the figure above) in the same rsyslog process by using rulesets. Think of rulesets as swim-lanes. They’re useful for example when you want to process local logs and remote logs in a completely separate manner
- queues can be in-memory, on disk, or a combination called disk-assisted. Here, we’ll use in-memory because they’re the fastest. For more information about how queues work, take a look here
Configuration
To generate messages, we used tcpflood, a small and light tool that’s part of rsyslog’s testbench. It generates messages and sends them over to the local syslog via TCP.
Rsyslog took received those messages with the imtcp input module, queued them and forwarded them to Elasticsearch 0.90.7, which was also installed locally. We also tried with Elasticsearch 1.0 and got the same results (see below).
The flow of messages in this test is represented in the following figure:

The actual rsyslog config is listed below (in the new configuration format). It can be tuned further (for example by using the multithreaded imptcp input module), but we didn’t get significant improvements in this particular scenario.
module(load="imtcp")   # TCP input module
module(load="omelasticsearch") # Elasticsearch output module

input(type="imtcp" port="13514")  # where to listen for TCP messages

main_queue(
  queue.size="1000000"   # capacity of the main queue
  queue.dequeuebatchsize="1000"  # process messages in batches of 1000 and move them to the action queues
  queue.workerthreads="2"  # 2 threads for the main queue
)

# template to generate JSON documents for Elasticsearch in Logstash format
template(name="plain-syslog"
         type="list") {
           constant(value="{")
             constant(value="\"@timestamp\":\"")      property(name="timereported" dateFormat="rfc3339")
             constant(value="\",\"host\":\"")        property(name="hostname")
             constant(value="\",\"severity\":\"")    property(name="syslogseverity-text")
             constant(value="\",\"facility\":\"")    property(name="syslogfacility-text")
             constant(value="\",\"syslogtag\":\"")   property(name="syslogtag" format="json")
             constant(value="\",\"message\":\"")    property(name="msg" format="json")
             constant(value="\"}")
         }

action(type="omelasticsearch"
       template="plain-syslog"  # use the template defined earlier
       searchIndex="test-index"
       bulkmode="on"                   # use the Bulk API
       queue.dequeuebatchsize="5000"   # ES bulk size
       queue.size="100000"   # capacity of the action queue
       queue.workerthreads="5"   # 5 workers for the action
       action.resumeretrycount="-1"  # retry indefinitely if ES is unreachable
)
You can see from the configuration that:
- both main and action queues have a defined size in number of messages
- both have number of threads that deliver messages to the next step. The action needs more because it has to wait for Elasticsearch to reply
- moving of messages from the queues happens in batches. For the Elasticsearch output, the batch of messages is sent through the Bulk API, which makes queue.dequeuebatchsize effectively the bulk size
Results
We started with default Elasticsearch settings. Then we tuned them to leave rsyslog with a more significant slice of the CPU. We monitored the indexing rate with SPM for Elasticsearch. Here are the average results over 20 million indexed events:
- with default Elasticsearch settings, we got 8,000 events per second
- after setting Elasticsearch up more production-like (5 second refresh interval, increased index buffer size, translog thresholds, etc), and the throughput went up to average of 20,000 events per second
- in the end, we went berserk and used in-memory indices, updated the mapping to disable any storing or indexing for any field, to have Elasticsearch do as little work as possible and make room for rsyslog. Got an average of 30,000 events per second. In this scenario, rsyslog was using between 1 and 1.5 of the 4 virtual CPU cores, with tcpflood using 0.5 and Elasticsearch using from 2 to 2.5
Conclusion
20K EPS on a low-end machine with production-like configuration means Elasticsearch is quick at indexing. This is very good for logs, where you typically have lots of messages being generated, compared to how often you search.
If you need some tool to ship your logs to Elasticsearch with minimum overhead, rsyslog version 8 may well be your best bet.
Related posts:
Output to Elasticsearch in Logstash format (Kibana-friendly)
Original post: Recipe rsyslog+Elasticsearch+Kibana by @Sematext
In this post you’ll see how you can take your logs with rsyslog and ship them directly to Elasticsearch (running on your own servers, or the one behind Logsene’s Elasticsearch API) in a format that plays nicely with Logstash. So you can use Kibana to search, analyze and make pretty graphs out of them.
This is especially useful when you have a lot of servers logging [a lot of data] to their syslog daemons and you want a way to search them quickly or do statistics on the logs. You can use rsyslog’s Elasticsearch output to get your logs into Elasticsearch, and Kibana to visualize them. The only challenge is to get your rsyslog configuration right, so your logs end up where Kibana is expecting them. And this is exactly what we’re doing here.
Getting all the ingredients
Here’s what you’ll need:
- a recent version of rsyslog (v8+ is recommended for best performance, although the Elasticsearch output is available since 6.4.0). You can download and compile it yourself, or you can get it from the RHEL/CentOS or Ubuntu repositories
- the Elasticsearch output plugin for rsyslog. If you compile rsyslog from sources, you’ll need to add the –enable-elasticsearch parameter to the configure script. If you use the repositories, just install the rsyslog-elasticsearch package
- Elasticsearch :). You have a DEB and a RPM there, which should get you started in no time. If you choose the tar.gz archive, you might find the installation instructions useful
- Kibana 3 and a web server to serve it. There are installation instructions on the GitHub page. To get started quickly, you can try the tar.gz archive from the download page that gets you Elasticsearch, too
Then, you’ll probably need to edit config.js to change the Elasticsearch host name from “localhost” to the actual FQDN of the host that’s running Elasticsearch. This applies even if Kibana is on the same machine as Elasticsearch. “localhost” only works if your browser is on the same machine as Elasticsearch, because Kibana talks to Elasticsearch directly from your browser.
Finally, you can serve the Kibana page with any HTTP server you prefer. If you want to get started quickly, you can try SimpleHTTPServer, which should be embedded to any recent Python, by running this command from the “kibana” directory:
python -m SimpleHTTPServer
Putting them all together
Kibana is, by default, expecting Logstash to send logs to Elasticsearch. So “putting them all together” here means “configuring rsyslog to send logs to Elasticsearch in the same manner Logstash does”. And Logstash, by default, has some particular ways when it comes to naming the indices and formatting the logs:
- indices should be formatted like logstash-YYYY.MM.DD. You can change the pattern Kibana is looking for, but we won’t do that here
- logs must have a timestamp, and that timestamp must be stored in the @timestamp field. It’s also nice to put the message part in the message field – because Kibana shows it by default
To satisfy the requirements above, here’s a rsyslog configuration that should work for sending your local syslog logs to Elasticsearch in a Logstash/Kibana-friendly way:
module(load="imuxsock") # for listening to /dev/log
module(load="omelasticsearch") # for outputting to Elasticsearch
# this is for index names to be like: logstash-YYYY.MM.DD
template(name="logstash-index"
type="list") {
constant(value="logstash-")
property(name="timereported" dateFormat="rfc3339" position.from="1" position.to="4")
constant(value=".")
property(name="timereported" dateFormat="rfc3339" position.from="6" position.to="7")
constant(value=".")
property(name="timereported" dateFormat="rfc3339" position.from="9" position.to="10")
}
# this is for formatting our syslog in JSON with @timestamp
template(name="plain-syslog"
type="list") {
constant(value="{")
constant(value="\"@timestamp\":\"") property(name="timereported" dateFormat="rfc3339")
constant(value="\",\"host\":\"") property(name="hostname")
constant(value="\",\"severity\":\"") property(name="syslogseverity-text")
constant(value="\",\"facility\":\"") property(name="syslogfacility-text")
constant(value="\",\"tag\":\"") property(name="syslogtag" format="json")
constant(value="\",\"message\":\"") property(name="msg" format="json")
constant(value="\"}")
}
# this is where we actually send the logs to Elasticsearch (localhost:9200 by default)
action(type="omelasticsearch"
template="plain-syslog"
searchIndex="logstash-index"
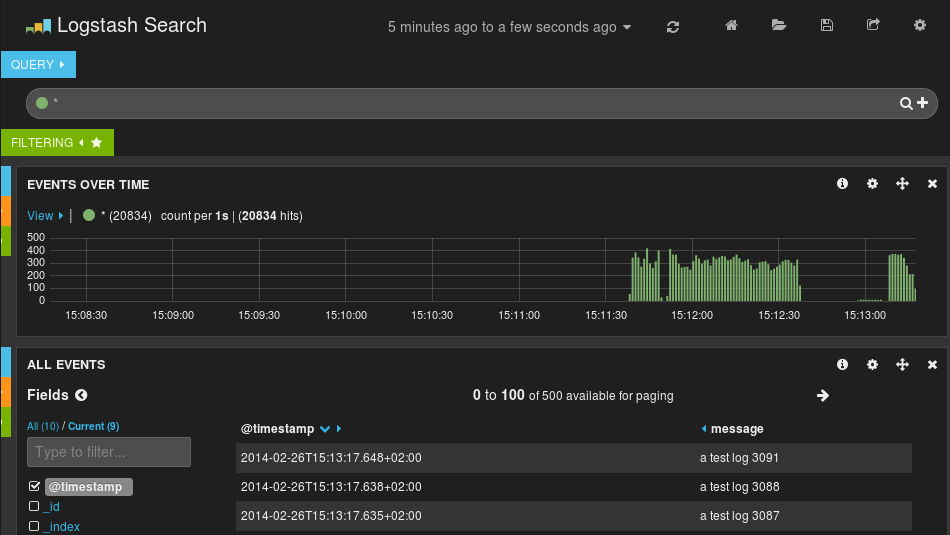
dynSearchIndex="on")After restarting rsyslog, you can go to http://host-serving-Kibana:8000/ in your browser and start searching and graphing your logs:
More tips
Now that you got the essentials working, here are some tips that might help you go even further with your centralized logging setup:
- you might not want to put the new rsyslog and omelasticsearch on all your servers. In this case you can forward them over the network to a central rsyslog that has omelasticsearch, and push your logs to Elasticsearch from there. Some information on forwarding logs via TCP can be found here and here
- you might want rsyslog to buffer your logs (in memory, on disk, or some combination of the two), in case Elasticsearch is not available for some reason. Buffering will also help performance, as you can send messages in bulks instead of one by one. There’s a reference on buffers with rsyslog&omelasticsearch here
- you might want to parse JSON-formatted (CEE) syslog messages. If you’re using them, check our earlier post on the subject: JSON logging with rsyslog and Elasticsearch
You can also hook rsyslog up to a log analytics service like Logsene, by either shipping logs via omelasticsearch or by sending them via UDP/TCP/RELP syslog protocols.
rsyslog and ElasticSearch
by Micah Yoder, originally published on rackspace. Minor changes through Adiscon.
There is a clear benefit to being able to aggregate logs from various servers and services into one place and be able to search them for any sort of arbitrary event. Traditional syslog can aggregate logs, but aggregating events from them sometimes involves grep and convoluted regular expressions. Logging structured data to a database makes a lot of sense. rsyslog and ElasticSearch can do that, but figuring out how to get it to work from the rsyslog documentation can be difficult. Let’s start from the beginning.
First, you need the newest stable rsyslog, 7.4.x. The older 7.2 won’t cut it. You need the plug-ins mmnormalize and omelasticsearch, both of which are available from rsyslog’s yum repositories for RHEL/CentOS. mmnormalize requires some packages from EPEL so that will need to be added to the server as well.
Let’s walk through this from the beginning, starting with the most basic rsyslog configuration:
module(load="imuxsock") # provides support for local system logging (e.g. via logger command)
module(load="imklog")   # provides kernel logging support (previously done by rklogd)
$ActionFileDefaultTemplate RSYSLOG_TraditionalFileFormat
*.*     /var/log/messages
This simply loads the necessary modules for basic logging operation, sets the normal log format, and sends everything to /var/log/messages. With this if you issue this command:
# logger 'hello world!'
You get this in /var/log/messages:
Mar 27 14:16:47 micahsyslog root: hello world!
There are several parts here: the date/time, the hostname, the syslog tag or program (root), and the message. Another example:
# service sshd restart
yields:
Mar 27 14:19:27 micahsyslog sshd[23295]: Received signal 15; terminating.
Mar 27 14:19:27 micahsyslog sshd[16602]: Server listening on 0.0.0.0 port 22.
Mar 27 14:19:27 micahsyslog sshd[16602]: Server listening on :: port 22.
By the way, if we remove the ActionFileDefaultTemplate directive, we get the default line with an ISO time, which is nicer for automatic processing but a bit less readable for humans:
2013-03-27T21:51:29.139796+00:00 micahsyslog root: Hello world #2!
That is good to know, but actually irrelevant for putting data into ElasticSearch. If you also log to text files, you can decide whether to use the ISO time or the more human readable time.
Now let’s try to get it to normalize messages from the log! For this example we will need rsyslog running with ActionFileDefaultTemplate directive (keep it in for now, but you can remove it later if you want).
Create a rulebase file, which will be used by liblognorm. liblognorm is a library written by Rainer Gerhards, the author of rsyslog, which parses log messages according to a pattern and extracts variables from them. We can create the file as /etc/rsyslog.d/rules.rb and put in these contents:
prefix=%date:date-rfc3164% %hostname:word% %tag:word%
rule=user: new user: name=%user:char-to:,%, UID=%uid:number%, GID=%gid:number%, home=%home:char-to:,%, shell=%shell:word%
rule=test: Hello %x:number%
Now if we log something:
# logger “Hello 55”
We should be able to get something like this:
# lognormalizer -r rsyslog.d/rules.rb -t test < /var/log/messages
[cee@115 event.tags="test" x="55" tag="root:" hostname="micahsyslog" date="Mar 27 22:53:30"]
See what happened? The lognormalizer command, which uses liblognorm, was able to pull out the number in the log as variable “x” according to our “test” rule.
A short description of the rule base is in order. The prefix line contains a prefix that will be applied to all following rules. A rule is defined by a line beginning with the word “rule”, followed by an “=” sign, an optional tag, then a “:”. A space should then follow – but the space is actually part of the rule! There will be a space after the prefix, so it needs to be there.
Documentation on the rulebase file can be found here: http://www.liblognorm.com/files/manual/index.html Then navigate to How to use liblognorm → Rulebase. This will show you all the directives you can use.
Now we need to get the data into ElasticSearch. First we need to install it, which is very simple (at least for a single test node). Just extract its tarball, change into the base directory, and run:
# bin/elasticsearch -f
The -f causes it to run in the foreground so you can see what is going on.
We then add this to rsyslog.conf:
module(load="mmnormalize")
module(load="omelasticsearch")

template(name="test" type="subtree" subtree="$!")

set $!fac = $syslogfacility;
set $!host = $hostname;
set $!sev = $syslogseverity;
set $!time = $timereported;
set $!tgen = $timegenerated;
set $!tag = $syslogtag;
set $!prog = $programname;

action(type="omelasticsearch" server="localhost" template="test")
So what is all this? First we load the modules to normalize the log messages and for export to ElasticSearch. These should be placed near the top of your rsyslog.conf file with any other includes.
The template statement tells which part of the CEE data should be sent to ElasticSearch. Here a brief explanation of the data structure is necessary.
JSON (the format for CEE logging data and the native format for ElasticSearch) is a hierarchical data structure. The root of the data structure in rsyslog is $! – something like the ‘{}’ in a JSON document. Assigning to $!data1 would put a value into the “data1” top level JSON element {“data”: “…”}. Trees can be built. If you assign to $!tree1!child1, you will get a JSON document like this: {“tree1: {“child1”: “…”}}
This rsyslog document lists the available properties that you can use to populate these CEE variables.
As of version 7.5.8, 7.6.0 and 8.1.4, not only the standard rsyslog properties and constants can be assigned to these variables. There is now a way to assign the result of an rsyslog template, which allows more complex values. That is what you need to put a sortable timestamp into the document. More information can be found in the guide to use “set variable and exec_template“.
As this was not available at the time of writing I needed to get around this limitation (sort of), so I created an ElasticSearch index with a timestamp. Here is the command I used:
curl -XPUT http://elasticsearch.hostname:9200/logs -d '{"mappings":{"events":{"_timestamp":{"enabled": true, "store": "yes"},"prog":{"store":"yes"},"host":{"store":"yes"}}}}'
This also “stores” the host and prog syslog fields, which should help with querying based on the host or program. This will create an index called “logs”. ElasticSearch by default inserts events into the “system” index so you will want to specify the index name in your omelasticsearch line in rsyslog.conf (or one of its includes):
action(type="omelasticsearch" server="elasticsearch.hostname" template="cee_template_name" searchIndex="logs" bulkmode="on")
We also enabled bulk mode, which allows rsyslog to send many events at once to ElasticSearch. This will greatly improve performance.
Now you can query it!
curl 'http://elasticsearch.hostname:9200/logs/_search?pretty=1&fields=_source,_timestamp&size=100' -d '{"sort":{"_timestamp": "desc"}}' | less
The “pretty=1” and piping it to less are simply there to pretty print the JSON result and make it easy for you to browse the data set. A real search program, of course, would not turn on pretty mode and the code would directly consume the JSON.
You can add parameters after the ‘size=100’ (which, of course, says to return the 100 most recent results).
- &q=word will search the logs for that word in any field.
- &q=prog:name will search for ‘name’ in the syslog program field. Examples: postfix, sudo, crontab
- &q=host:hostname will find events for that hostname. Just use the base hostname, not a FQDN.
And that should get you started! Hopefully this is helpful.
Parsing JSON (CEE) Logs and Sending them to Elasticsearch
Original post: Structured Logging with rsyslog and Elasticsearch via @sematext
When your applications generate a lot of logs, you’d probably want to make some sense of them through searches and statistics. Here’s when structured logging comes in handy, and I would like to share some thoughts and configuration examples of how you could use a popular syslog daemon like rsyslog to handle both structured and unstructured logs. Then I’ll show you how to:
- take a JSON from a syslog message and index it in Elasticsearch (which eats JSON documents)
- append other syslog properties (like the date) to the existing JSON to make a bigger JSON document that would be indexed in Elasticsearch. This is how we set up rsyslog to handle CEE-formatted messages in our log analytics tool, Logsene
On structured logging
If we take an unstructured log message, like:
Joe bought 2 apples
And compare it with a similar one in JSON, like:
{“name”: “Joe”, “action”: “bought”, “item”: “apples”, “quantity”: 2}
We can immediately spot a good and a bad point of structured logging: if we index these logs, it will be faster and more precise to search for “apples” in the “item” field, rather than in the whole document. At the same time, the structured log will take up more space than the unstructured one.
But in most use-cases there will be more applications that would log the same subset of fields. So if you want to search for the same user across those applications, it’s nice to be able to pinpoint the “name” field everywhere. And when you add statistics, like who’s the user buying most of our apples, that’s when structured logging really becomes useful.
Finally, it helps to have a structure when it comes to maintenance. If a new version of the application adds a new field, and your log becomes:
Joe bought 2 red apples
it might break some log-parsing, while structured logs rarely suffer from the same problem.
Enter CEE and Lumberjack: structured logging with syslog
With syslog, as defined by RFC3164, there is already a structure in the sense that there’s a priority value (severity*8 + facility), a header (timestamp and hostname) and a message. But this usually isn’t the structure we’re looking for.
CEE and Lumberjack are efforts to introduce structured logging to syslog in a backwards-compatible way. The process is quite simple: in the message part of the log, one would start with a cookie string “@cee:”, followed by an optional space and then a JSON or XML. From this point on I will talk about JSON, since it’s the format that both rsyslog and Elasticsearch prefer. Here’s a sample CEE-enhanced syslog message:
@cee: {“foo”: “bar”}
This makes it quite easy to use CEE-enhanced syslog with existing syslog libraries, although there are specific libraries like liblumberlog, which make it even easier. They’ve also defined a list of standard fields, and applications should use those fields where they’re applicable – so that you get the same field names for all applications. But the schema is free, so you can add custom fields at will.
CEE-enhanced syslog with rsyslog
rsyslog has a module named mmjsonparse for handling CEE-enhanced syslog messages. It checks for the “CEE cookie” at the beginning of the message, and then tries to parse the following JSON. If all is well, the fields from that JSON are loaded and you can then use them in templates to extract whatever information seems important. Fields from your JSON can be accessed like this: $!field-name. An example of how they can be used is shown here.
To get started, you need to have at least rsyslog version 6.6.0, and I’d recommend using version 7 or higher. If you don’t already have that, check out the repositories for RHEL/CentOS and Ubuntu.
Also, mmjsonparse is not enabled by default. If you use the repositories, install the rsyslog-mmjsonparse package. If you compile rsyslog from sources, specify –enable-mmjsonparse when you run the configure script. In order for that to work you’d probably have to install libjson and liblognorm first, depending on your operating system.
For a proof of concept, we can take this config:
#load needed modules
module(load="imuxsock") # provides support for local system logging
module(load="imklog") # provides kernel logging support
module(load="mmjsonparse") #for parsing CEE-enhanced syslog messages

#try to parse structured logs
*.* :mmjsonparse:

#define a template to print field "foo"
template(name="justFoo" type="list") {
  property(name="$!foo")
  constant(value="\n") #we'll separate logs with a newline
}

#and now let's write the contents of field "foo" in a file
*.* action(type="omfile"
           template="justFoo"
           file="/var/log/foo")
To see things, better, you can start rsyslog in foreground and in debug mode:
rsyslogd -dn
And in another terminal, you can send a structured log, then see the value in your file:
# logger ‘@cee: {“foo”:”bar”}’
# cat /var/log/foo
bar
If we send an unstructured log, or an invalid JSON, nothing will be added
# logger ‘test’
# logger ‘@cee: test2’
# cat /var/log/foo
bar
But you can see in the debug output of rsyslog why:
mmjsonparse: no JSON cookie: ‘test’
[…]
mmjsonparse: toParse: ‘ test2’
mmjsonparse: Error parsing JSON ‘ test2’: boolean expected
Indexing logs in Elasticsearch
To index our logs in Elasticsearch, we will use an output module of rsyslog called omelasticsearch. Like mmjsonparse, it’s not compiled by default, so you will have to add the –enable-elasticsearch parameter to the configure script to get it built when you run make. If you use the repositories, you can simply install the rsyslog-elasticsearch package.
omelasticsearch expects a valid JSON from your template, to send it via HTTP to Elasticsearch. You can select individual fields, like we did in the previous scenario, but you can also select the JSON part of the message via the $!all-json property. That would produce the message part of the log, without the “CEE cookie”.
The configuration below should be good for inserting the syslog message to an Elasticsearch instance running on localhost:9200, under the index “system” and type “events“.
#load needed modules
module(load="imuxsock") # provides support for local system logging
module(load="imklog") # provides kernel logging support
module(load="mmjsonparse") #for parsing CEE-enhanced syslog messages
module(load="omelasticsearch") #for indexing to Elasticsearch

#try to parse a structured log
*.* :mmjsonparse:

#define a template to print all fields of the message
template(name="messageToES" type="list") {
  property(name="$!all-json")
}

#write the JSON message to the local ES node
*.* action(type="omelasticsearch"
           template="messageToES")
After restarting rsyslog, you can see your JSON will be indexed:
# logger ‘@cee: {“foo”: “bar”, “foo2”: “bar2″}’
# curl -XPOST localhost:9200/system/events/_search?q=foo2:bar2 2>/dev/null | sed s/.*_source//
” : { “foo”: “bar”, “foo2”: “bar2” }}]}}
As for unstructured logs, $!all-json will produce a JSON with a field named “msg”, having the message as a value:
# logger test
# curl -XPOST localhost:9200/system/events/_search?q=test 2>/dev/null | sed s/.*_source//
” : { “msg”: “test” }}]}}
It’s “msg” because that’s rsyslog’s property name for the syslog message.
Including other properties
But the message isn’t the only interesting property. I would assume most would want to index other information, like the timestamp, severity, or host which generated that message.
To do that, one needs to play with templates and properties. In the future it might be made easier, but at the time of this writing (rsyslog 7.2.3), you need to manually craft a valid JSON to pass it to omelasticsearch. For example, if we want to add the timestamp and the syslogtag, a working template might look like this:
template(name="customTemplate"
   type="list") {
#- open the curly brackets,
#- add the timestamp field surrounded with quotes
#- add the colon which separates field from value
#- open the quotes for the timestamp itself
   constant(value="{\"timestamp\":\"")
#- add the timestamp from the log,
# format it in RFC-3339, so that ES detects it by default
   property(name="timereported" dateFormat="rfc3339")
#- close the quotes for timestamp,
#- add a comma, then the syslogtag field in the same manner
   constant(value="\",\"syslogtag\":\"")
#- now the syslogtag field itself
# and format="json" will ensure special characters
# are escaped so they won't break our JSON
   property(name="syslogtag" format="json")
#- close the quotes for syslogtag
#- add a comma
#- then add our JSON-formatted syslog message,
# but start from the 2nd position to omit the left
# curly bracket
   constant(value="\",")
   property(name="$!all-json" position.from="2")
}
Summary
If you’re interested in searching or analyzing lots of logs, structured logging might help. And you can do it with the existing syslog libraries, via CEE-enhanced syslog. If you use a newer version of rsyslog, you can parse these logs with mmjsonparse and index them in Elasticsearch with omelasticsearch. If you are interested in indexing/searching logs in general, check out other Sematext logging posts or follow @sematext.
rsyslog statistic counter plugin omelasticsearch
Plugin – omelasticsearch
This plugin maintains global statistics, which accumulate all action instances. The statistic is named “omelasticsearch”. Parameters are:
- submitted – number of messages submitted for processing (with both success and error result)
- fail.httprequests – the number of times a http request failed. Note that a single http request may be used to submit multiple messages, so this number may be (much) lower than fail.http.
- fail.http – number of message failures due to connection like-problems (things like remote server down, broken link etc)
- fail.es – number of failures due to elasticsearch error reply; Note that this counter does NOT count the number of failed messages but the number of times a failure occured (a potentially much smaller number). Counting messages would be quite performance-intense and is thus not done.
The fail.httprequests and fail.http counters reflect only failures that omelasticsearch detected. Once it detects problems, it (usually, depends on circumstances) tell the rsyslog core that it wants to be suspended until the situation clears (this is a requirement for rsyslog output modules). Once it is suspended, it does NOT receive any further messages. Depending on the user configuration, messages will be lost during this period. Those lost messages will NOT be counted by impstats (as it does not see them).
Note that some previous (pre 7.4.5) versions of this plugin had different counters. These were experimental and confusing. The only ones really used were “submits”, which were the number of successfully processed messages and “connfail” which were equivalent to “failed.http”.
Changelog for 7.4.5 (v7-stable)
Version 7.4.5 [v7.4-stable] 2013-10-22
- mmanon: removed the check for specific “terminator characters” after
last octet. As it turned out, this didn’t work in practice as there
was an enormous set of potential terminator chars — so removing
them was the best thing to do. Note that this may change behaviour of
existing installations. Yet, we still consider this an important
bugfix, that should be applied to the stable branch.
closes: http://bugzilla.adiscon.com/show_bug.cgi?id=477
Thanks to Muri Cicanor for initiating the discussion - now requires libestr 0.1.8 as early versions had a nasty bug in
string comparisons - omelasticsearch: add failed.httprequests stats counter
- bugfix: invalid property filter was not properly disabled in ruleset
Note that this bugfix introduces a very slight memory leak, which is
cosmetic, as it just holds data until termination that is no longer
needed. It is just the part of the config that was invalid. We will
“fix” this “issue” in the devel version first, as the fix is a bit
too intrusive to do without hard need in the stable version. - bugfix: segfault if re_extract() function was used and no match found
- bugfix: potential misadressing on startup if property-filter was used
This could happen if the property name was longer than 127 chars, a case
that would not happen in practice. - bugfix: omelasticsearch: correct failed.http stats counter
- bugfix: omelasticsearch: did not correctly initialize stats counters
- bugfix: omelasticsearch: failed.es counter was only maintained in bulk mode
This usually did not lead to any problems, because they are in static
memory, which is initialized to zero by the OS when the plugin is
loaded. But it may cause problems especially on systems that do not
support atomic instructions – in this case the associated mutexes also
did not get properly initialized. - bugfix: mmanon did not detect all IP addresses in rewrite mode
The problem occured if two IPs were close to each other and the first one
was shrunk.
closes: http://bugzilla.adiscon.com/show_bug.cgi?id=485
Thanks to micah-at-riseup.net for reporting this bug - bugfix: mmanon sometimes used invalid replacement char in simple mode
depending on configuration sequence, the replacement character was set
to ‘s’ instead of the correct value. Most importantly, it was set to
‘s’ if simple mode was selected and no replacement char set.
closes: http://bugzilla.adiscon.com/show_bug.cgi?id=484
Thanks to micah-at-riseup.net for reporting this bug - bugfix: memory leak in mmnormalize
- bugfix: array-based ==/!= comparisions lead to invalid results
This was a regression introduced in 7.3.5 bei the PRI optimizer - bugfix: omprog blocked signals to executed programs
The made it impossible to send signals to programs executed via
omprog.
Thanks to Risto Vaarandi for the analysis and a patch. - bugfix: doc: imuxsock legacy param $SystemLogSocketParseTrusted was
misspelled
Thanks to David Lang for alerting us - bugfix: imfile “facility” input parameter improperly handled
caused facility not to be set, and severity to be overwritten with
the facility value.
Thanks to forum user dmunny for reporting this bug. - bugfix: small memory leak in imfile when $ResetConfigVariables was used
Thanks to Grégory Nuyttens for reporting this bug and providig a fix - bugfix: segfault on startup if TLS was used but no CA cert set
- bugfix: segfault on startup if TCP TLS was used but no cert or key set
- bugfix: some more build problems with newer json-c versions
Thanks to Michael Biebl for mentioning the problem. - bugfix: build system: libgcrypt.h needed even if libgrcypt was disabled
Thanks to Jonny Törnbom for reporting this problem