How To Export the Configuration and Create a Debug Log File
This Article describes you how you can export the configuration of your program and create a debug file. These are needed for troubleshooting.
The Article is applicable to Rsyslog Windows Agent, EventReporter, MonitorWare Agent and WinSyslog.
Continue reading “How To Export the Configuration and Create a Debug Log File”
RSyslog Windows Agent 4.3 Released
Adiscon is proud to announce the 4.3 release of MonitorWare Agent.
This release contains some minor but useful features. Most important the debug output format has been enhanced. The new configuration client contains a DebugLog Viewer which lets you load and analyze the debug log in real-time. It is even possible to filter debug output by Service or Action which makes troubleshooting configuration issues much easier. For more details on all changes see the Version History.
Detailed information can be found in the version history below.
Build-IDs: Service 4.3.0.175, Client 4.3.0.255
Features |
|
Bugfixes |
|
Version 4.3 is a free download. Customers with existing 3.x keys can contact our Sales department for upgrade prices. If you have a valid Upgrade Insurance ID, you can request a free new key by sending your Upgrade Insurance ID to sales@adiscon.com. Please note that the download enables the free 30-day trial version if used without a key – so you can right now go ahead and evaluate it.
How to create debug information with strace
Strace is a tool to monitor system calls of an application. The output may be useful to trace what rsyslog is actually doing on the system level, if debug output information is not sufficient.
A quick example to provide useful output would be:
strace -T -ttt -f -o /path/filename rsyslogd
There are a lot of parameters that can be set. For example we can also only monitor system calls related to the network components:
strace -T -ttt -e trace=network -f -o /path/filename rsyslogd
For more details, please visit the man page of strace.
How to check if config variables are used?
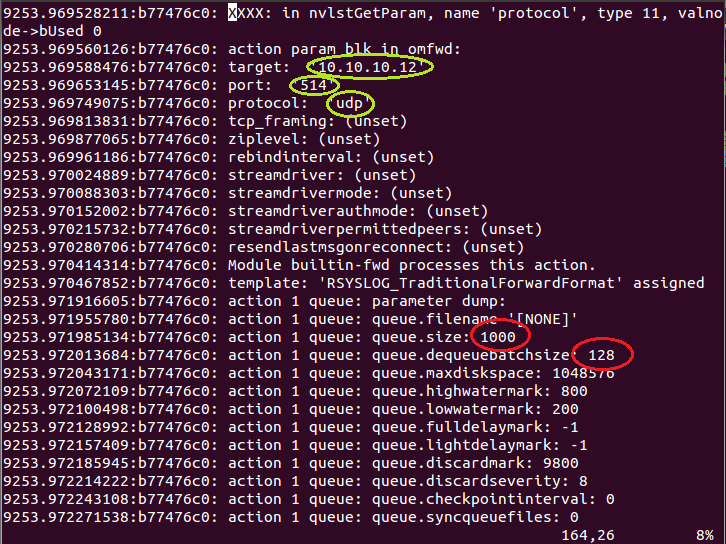
Sometimes you might wonder, if the configuration you created is really used. At least parts of it. This could really happen in a lot of situations. Currently, the config format is changed a lot. This forces users who want to use the new format to use a mixed mode of old and new config style. And this is where a lot of confusion can occur, which results in not properly set config variables. In fact, you just need to create some consistency in the configuration. Most output modules are already updated. If you want to use the new format, you cannot use some old config directives and use some new config directives at the same time. The old ones will be simply ignored then. Instead the default values will be used. A very common case is with queues and this is what I will use for my example. I will show, how you can identify if configuration directives are used correctly. We will use the debug log for this. The rsyslog version I will use is the 6.3.12 beta. In this version, the main message queue still needs to be configured with the old config directives, whereas action queues already support the new config directives. You can enable debug mode for rsyslog with the following commands in a terminal:
export RSYSLOG_DEBUGLOG="/path/to/debuglog" export RSYSLOG_DEBUG="Debug"
You can now start rsyslog on the same command line with:
rsyslogd -c6
You will usually see the debug output in that same terminal, as rsyslog runs in the foreground. That should now just serve as a indicator, that the debug output works. Now here is the config snippet I used:
$ActionQueueType LinkedList $ActionQueueSize 2000000 $ActionQueueTimeoutEnqueue 0 $ActionQueueDequeueBatchSize 400 *.* action(type="omfwd" target="10.10.10.12" port="514" protocol="udp")
As you can see, we configured the action queue with some custom variables in the old fashion, basically the action queue and the action itself with the new style. If you create a new debug file now and review it, search for “action 1” in this case. You should see the following. 
