How to setup RSyslog Windows Agent to monitor NetApp devices using backup *.evt files
This article describes how to use RSyslog Windows Agent to monitor NetApp devices using the backup .evt files. In this guide we describe how to setup the service. For creating the actions, please refer to the our other guides.
There are basically two methods to monitor logs of NetApp devices. The first, described here, is to monitor the .evt files that the NetApp device generates. The second method is to monitor the device via the Eventlog API. Instructions can be found here.
The NetApp device basically offers to access the .evt files via a network share. Thus the files are easily accessible through our products.
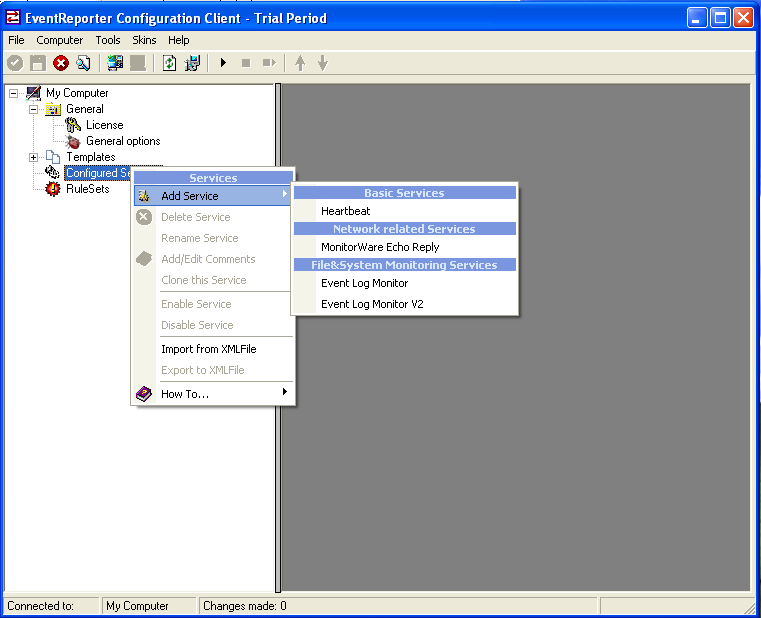
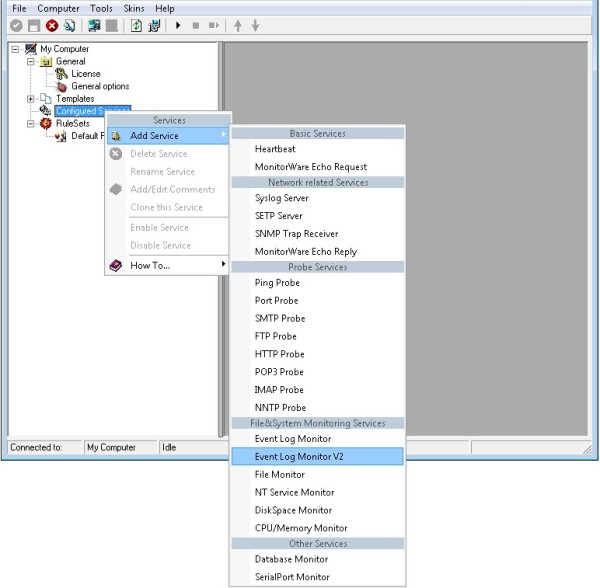
Basically, we need to create the Event Log Monitor service in RSyslog Windows Agent. Simply right-click on services and from the popup list, choose “Add Service” and the “Event Log Monitor”.
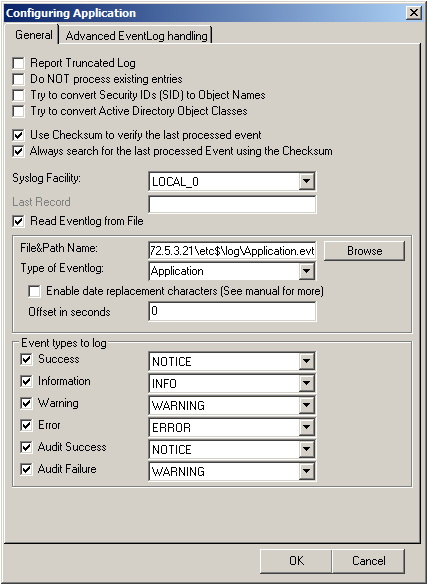
Now disable all the currently available logs except for one. Double click on the one that is still checked. A new window opens.
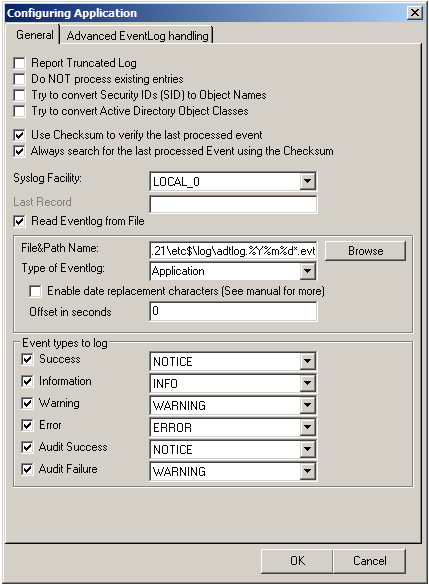
In this new windows, enable the option “Read Eventlog from File”. The parameters belonging to this option are now available. Insert the file and path name into the field. Alternatively, you can use the browse button to navigate to the remote location of the NetApp and choose the file like that. You could now also change the “Type of Eventlog” if necessary.
Please note, that this method is also fit to monitor multiple files. You only need to change the file name accordingly and insert wildcards to replace name values like dates. This is good for cases, when a new log file is created every day and the filename reflects the date when the file was created, like below for file like adtlog.20130206110000.evt or adtlog.20130206121314.evt.
So thats it basically. You can now choose to forward the log messages via syslog to a central log host, write them into a database or use one of the many other options that are available in RSyslog Windows Agent.
librelp 1.0.6
librelp 1.0.6 [download]: enhanced API to permit binding a client to a specific IP address [sha256 hash: 9b4304ff3302c60be03bb9bed82d15420bce51b72f836877e47622cd5417f6ab]
librelp 1.0.5
librelp 1.0.5 [download]: bugfix for compile problem on Solaris (Thanks to John Lyman for the patch) [sha256 hash: 5e98bf47d81cbe1ec0ea99fc42595943904c0cac11d5966408e4afcbca34d972]
librelp 1.0.3
librelp 1.0.3 [download]: added support for user-settable shutdown indicator, improved timeout handling [sha256 hash: bc052f061d79a0254b29a38b15d32757561c6e83a8fa91598943098b18aa9bff]
librelp 1.0.2
librelp 1.0.2 [download]: added capability to support only IPv4/v6 instead of both [sha256 hash:d8ef77cb00f7d4db9ff96157242b3e4fb0eb0d68d7e846fcf12dc5fed92e4d4a]
librelp 1.0.1
librelp 1.0.1 [download]: capability to stop server without canceling its thread, bugfix: interrupt of select() not properly handled.
How to setup rsyslog to get Event Logs from a second maschine
The Article is applicable to all versions of EventReporter, MonitorWare Agent and rsyslog.
1. Configure EventReporter with a Service “Eventlog Monitor Service”.
Attention if you use Windows Vista or Windows 7 skip to step 1.2.
First, right click on “Services”, then select “Add Service” and then “Event Log Monitor”:
Once you have done so, a new wizard starts.
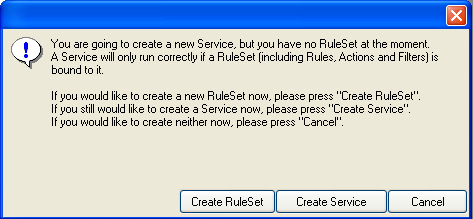
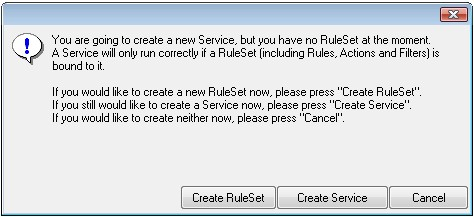
If the following Pop-up appears, please select “Create Service”:
Again, you can use either the default name or any one you like. We will use “My Event Log Monitor” in this sample. Leave the “Use default settings” selected and press “Next”.
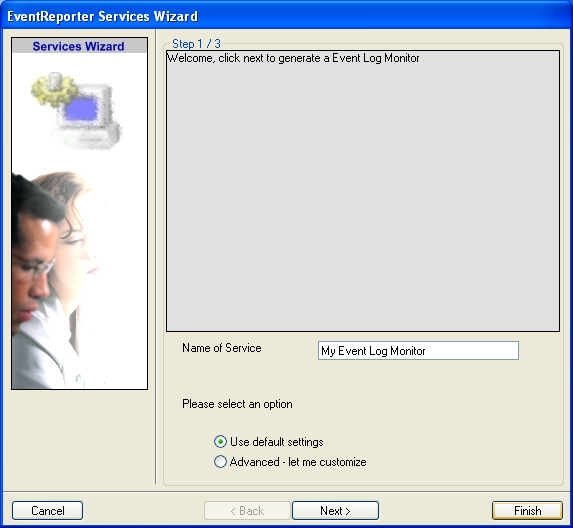
As we have used the default, the wizard will immediately proceed with step 3, the confirmation page. Press “Finish” to create the service. The wizard completes and returns to the configuration client.
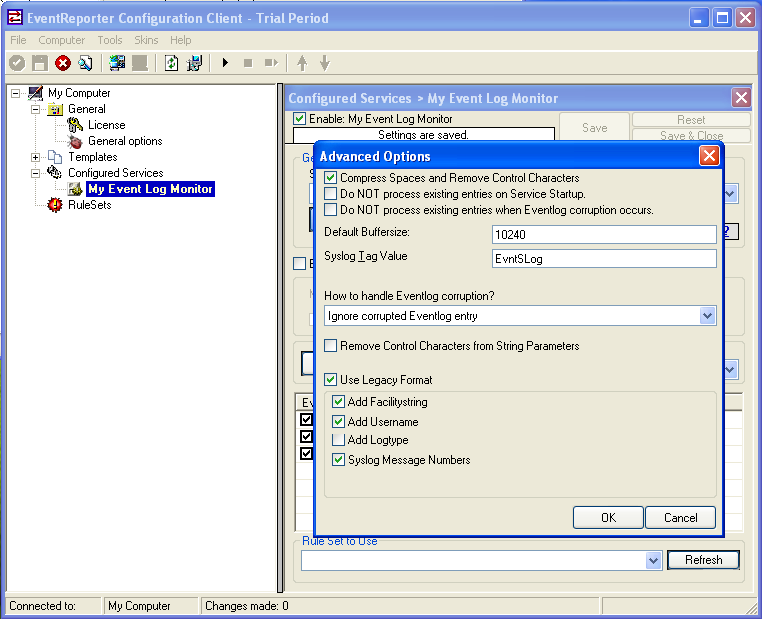
Now, you will see the newly created service beneath the “Services” part of the tree view. To check its parameters, select it. Click on Advanced Options then select “Use Legacy Format” :
1.2 Configure EventReporter with a Service “Eventlog Monitor Service 2”.
Note: This guide explains how to set up the EventLog Monitor Service for Windows Vista. These steps are not applicable if you are using Windows XP.
First, right click on “Services”, then select “Add Service” and then “Event Log Monitor V2”:
Once you have done so, a new wizard starts.
If the following Popup appears, please select “Create Service”:
Again, you can use either the default name or any one you like. We will use the default name in this sample. Leave the “Use default settings” selected and press “Next”.
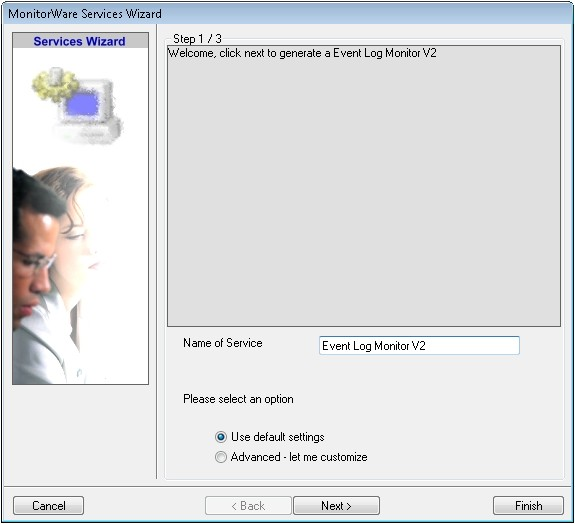
As we have used the default, the wizard will immediately proceed with step 3, the confirmation page. Press “Finish” to create the service. The wizard completes and returns to the configuration client.
Now, you will see the newly created service beneath the “Services” as part of the tree view. To check its parameters, select it:
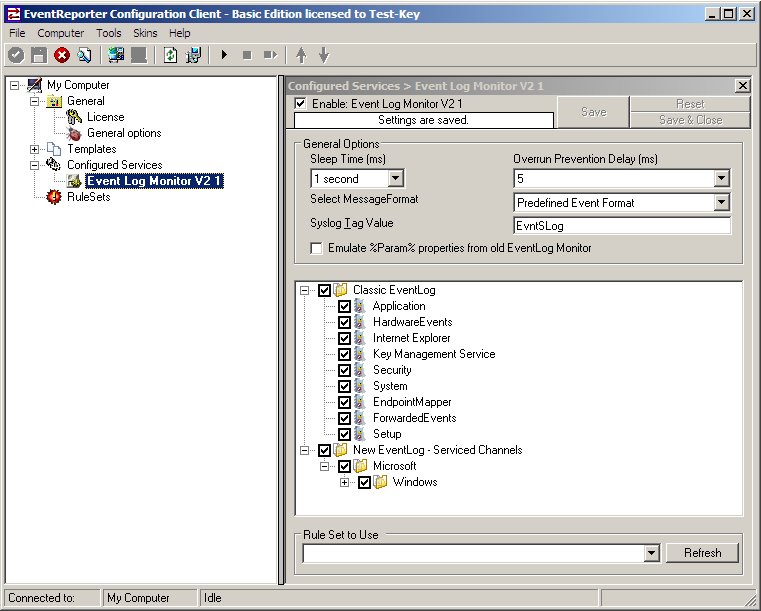
As you can see, the service has been created with the default parameters.
2. Add a “Forward via Syslog” Action.
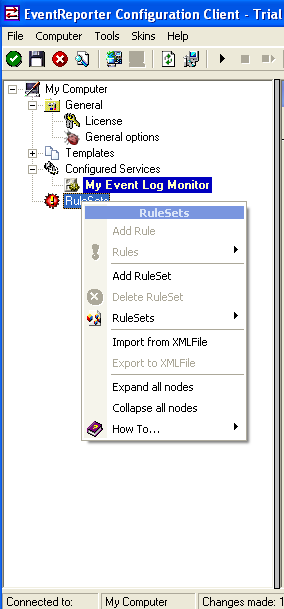
First we define a new rule set. Right-click “Rules”. A popup menu will appear. Select “Add Rule Set” from this menu. On screen, it looks as follows:
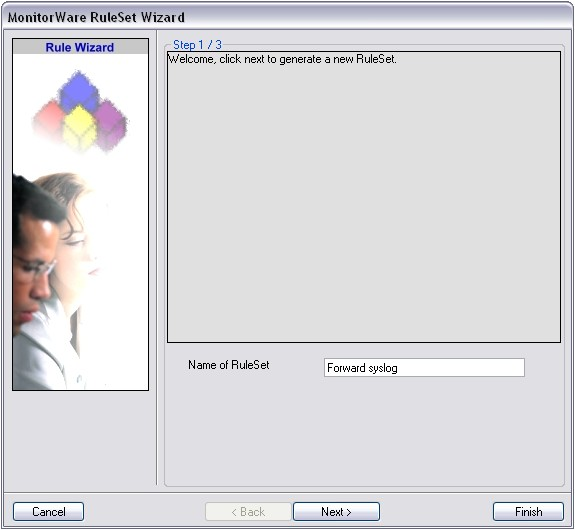
Then, a wizard starts. Change the name of the rule to whatever name you like. We will use “Forward syslog” in this example. The screen looks as follow:
Click “Next” to go on with the next step.
Select only Forward via Syslog. Do not select any other options for this sample. Also, leave the “Create a Rule for each of the following actions” setting selected. Click “Next”. You will see a confirmation page. Click “Finish” to create the rule set.
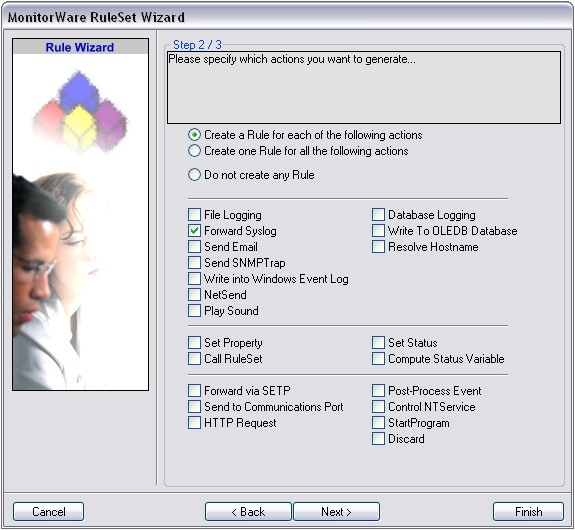
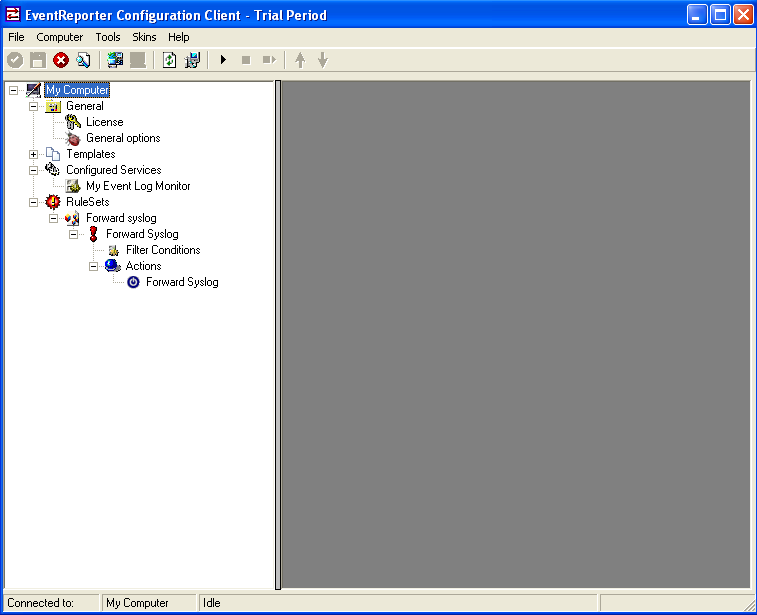
As you can see, the new Rule Set “Forward syslog” is present. Please expand it in the tree view until the action level of the “Forward syslog” Rule and select the “Forward syslog” action to configure.
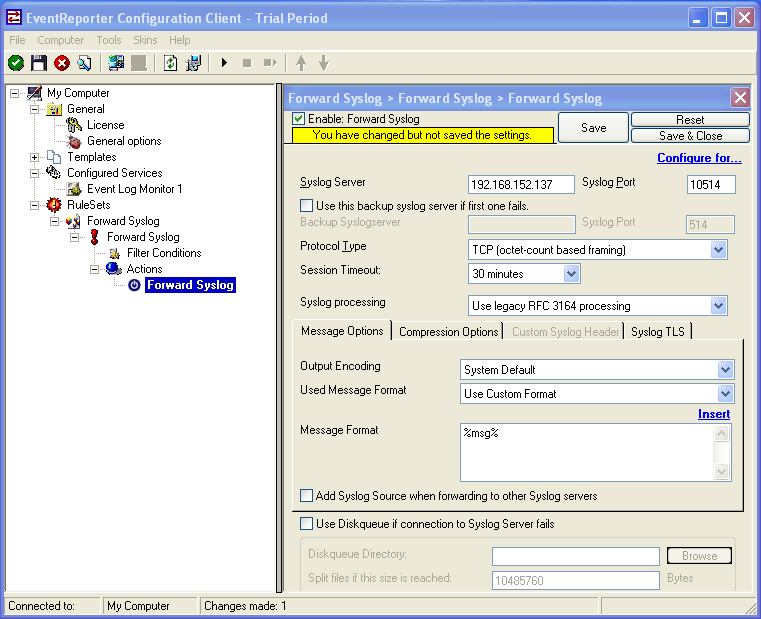
3. Configure the “Forward via Syslog” Action.
Now, we are going to configure the necessary settings for forwarding via syslog. Type the IP or the hostname of your syslog server into the Syslog Server field in the form. Then Change the protocol to “TCP (octet-count based framing”. We use TCP that we will have no traffic lost. And edit the Port to 10514. Attention EventReporter and rsyslog must use the same port and the same protocol.
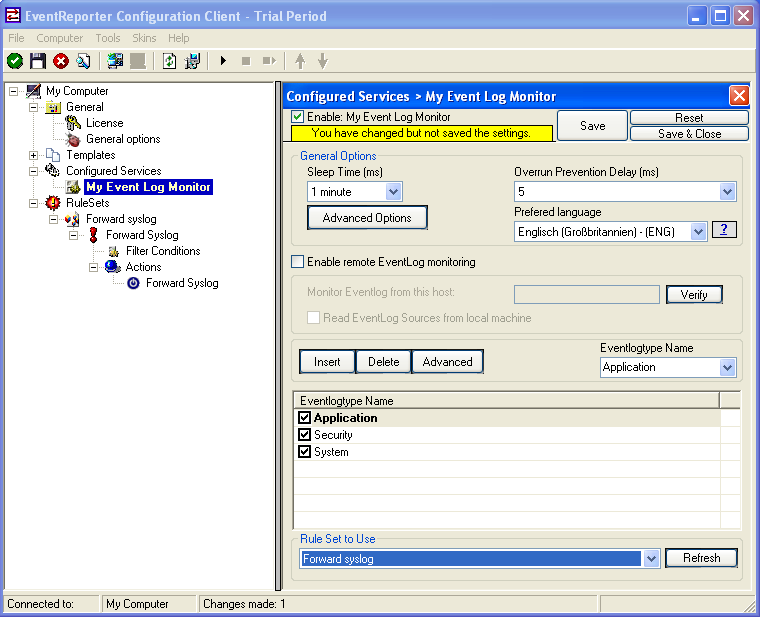
4. Configure Event Log Monitor which Rule to use.
Then Left-Click on Event Log Monitor then change “Rule Set to Use” to your Rule set. On the screen, it looks as follows:
5. Setup rsyslog for TCP reception
Now, we are going to configure the necessary settings for the TCP reception. Because EventReporter forward via syslog over a TCP connection so rsyslog must reception TCP.
Then open the rsyslog configuration. The normal path is “/etc/rsyslog.conf” and copy and paste this code into the Configuration.
Use this code for the TCP Syslog reception:
# Provides TCP Syslog reception
$ModLoad imtcp.so
$InputTCPServerRun 10514
If you use a UPD connection then use this code:
# Provides UDP syslog reception
$ModLoad imudp.so
$UDPServerRun 10514
Please restart rsyslog afterwards.
6. Test rsyslog
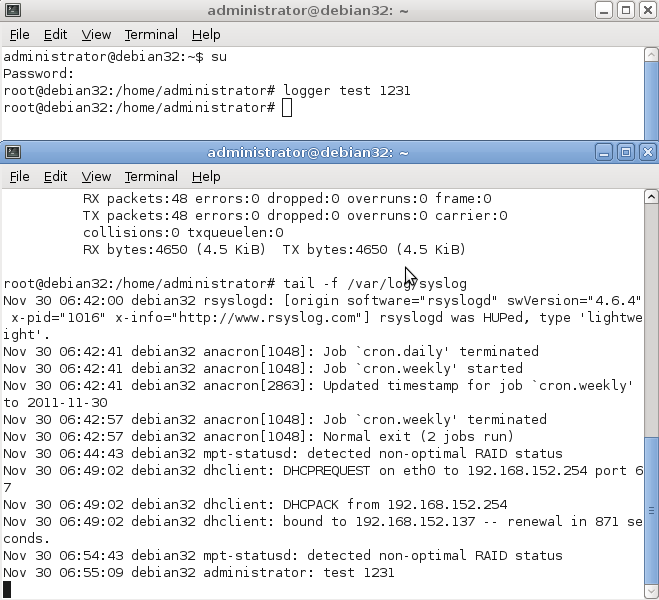
First switch to your Unix machine then open a new command prompt under Unix then type “tail -f /var/log/syslog”. With this command you now see all log messages which rsyslog receive.
Then open a new command prompt and write “logger test 1231”. Then you must see the message in the first command prompt.
On the screen, it looks as follows:
7. Verifying the configuration of rsyslog and EventReporter
First open a new command prompt under Unix then type “tail -f /var/log/syslog”.
Then switch to the second machine and start EventReporter. Then switch to your Unix machine and watch the command prompt there you see the incoming “Eventlogs” in the command prompt.
On the screen its look like:
If nothing arrive then check your EventReporter and rsyslog configuration if both use the same port and if both use the same protocol.
That’s it. This is how to receive syslog data from another device.
librelp 1.0.0
librelp 1.0.0 [download]: bugfix: IP address is now posted to callback function
librelp 0.1.3
librelp 0.1.3 [download]: some bugfixes, interface extension
librelp 0.1.1
librelp 0.1.1 [download]: minor feature update