Troubleshooting
This guide covers common issues with ROSI Collector and how to resolve them.
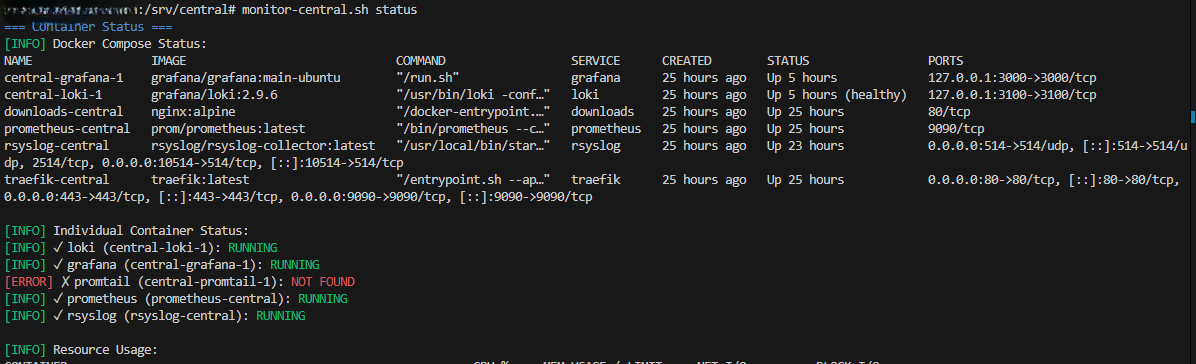
Monitor script showing container status
Diagnostic Commands
Start troubleshooting with these commands:
Using the Monitor Script
After running init.sh, the rosi-monitor command is available:
rosi-monitor status    # Container status overview
rosi-monitor logs      # Recent logs from all containers
rosi-monitor health    # Quick health check
rosi-monitor debug     # Interactive debug menu
Direct Docker Commands
# Check container status
docker compose ps

# View recent logs
docker compose logs --tail=100

# Follow logs in real-time
docker compose logs -f

# Check specific service
docker compose logs grafana
docker compose logs loki
docker compose logs rsyslog
Logs Not Appearing in Grafana
Symptom: Clients are configured but no logs appear in Grafana.
Check 1: rsyslog is receiving logs
docker compose logs rsyslog | tail -20
Look for incoming message indicators or errors.
Check 2: Network connectivity
From a client:
telnet COLLECTOR_IP 10514
# Should connect. Type some text and press Enter.
# Ctrl+] then 'quit' to exit
If connection fails, check firewalls on both client and collector.
Check 3: rsyslog is sending to Loki
docker compose logs rsyslog | grep -i loki
Look for omhttp connection messages or errors.
Check 4: Loki is healthy
curl http://localhost:3100/ready
# Should return: ready

curl http://localhost:3100/metrics | grep loki_ingester
Check 5: Client rsyslog queue
On the client:
ls -la /var/spool/rsyslog/
# Growing files indicate delivery problems
Container Won’t Start
Symptom: docker compose up fails or containers restart repeatedly.
Check 1: View logs
docker compose logs <service-name>
Look for error messages indicating the cause.
Check 2: Port conflicts
sudo netstat -tlnp | grep -E "80|443|3000|3100|9090|10514"
If ports are in use, stop conflicting services or change ports in
docker-compose.yml.
Check 3: Disk space
df -h
docker system df
Remove old containers and images if disk is full:
docker system prune -a
Check 4: Permissions
Ensure volumes have correct ownership:
docker compose down
sudo chown -R 472:472 ./grafana-data  # Grafana user
sudo chown -R 10001:10001 ./loki-data  # Loki user
docker compose up -d
Loki Storage Issues
Symptom: Loki crashes or queries fail.
Check 1: Available disk space
Loki needs space for chunks and index:
df -h
du -sh /var/lib/docker/volumes/*loki*
Check 2: Retention settings
If disk is filling up, reduce retention in loki-config.yml:
limits_config:
  retention_period: 168h  # 7 days instead of 30
Restart Loki after changes:
docker compose restart loki
Check 3: Compaction running
docker compose logs loki | grep -i compact
Compaction reclaims space from deleted logs.
Prometheus Scrape Failures
Symptom: Client metrics don’t appear; targets show as “DOWN”.
Check 1: Targets status in Prometheus
curl http://localhost:9090/api/v1/targets | jq .
Or visit http://YOUR_DOMAIN:9090/targets in a browser.
Check 2: Network connectivity to clients
From the collector:
curl http://CLIENT_IP:9100/metrics | head
If this fails:
Check client firewall allows port 9100 from collector IP
Verify node_exporter is running on client
Check for network routing issues
Check 3: Targets file syntax
cat prometheus-targets/nodes.yml
YAML syntax must be valid. Each target needs proper indentation.
Server node_exporter Issues
Symptom: Server target (the collector host itself) shows as “DOWN” in Prometheus.
The node_exporter on the server must bind to the Docker bridge gateway IP for Prometheus (running inside a container) to reach it.
Check 1: View Docker network info
rosi-monitor status
# Shows: Network, Subnet, Gateway, and all container IPs
Check 2: Verify node_exporter binding
grep listen-address /etc/systemd/system/node_exporter.service
# Should match the Docker network gateway IP
Check 3: Get correct Docker gateway IP
# Find the network containers are using
docker inspect central-grafana-1 --format '{{range $k, $v := .NetworkSettings.Networks}}{{$k}}{{end}}'

# Get the gateway for that network
docker network inspect rosi-collector-net --format '{{range .IPAM.Config}}{{.Gateway}}{{end}}'
Check 4: Fix node_exporter binding
If the IPs don’t match:
# Get correct IP
BIND_IP=$(docker network inspect rosi-collector-net --format '{{range .IPAM.Config}}{{.Gateway}}{{end}}')

# Update service file
sed -i "s/listen-address=[0-9.]*/listen-address=${BIND_IP}/" /etc/systemd/system/node_exporter.service

# Reload and restart
systemctl daemon-reload
systemctl restart node_exporter
Check 5: Firewall allows container access
# Check existing rules
ufw status | grep 9100

# Add rule if missing (adjust subnet to match your Docker network)
ufw allow from 172.20.0.0/16 to 172.20.0.1 port 9100 proto tcp comment "node_exporter from Docker"
Check 6: Test from Prometheus container
# Replace IP with your Docker gateway
docker exec prometheus-central wget -q -O - --timeout=3 http://172.20.0.1:9100/metrics | head -3
If this works, Prometheus should scrape successfully within 1-2 minutes.
TLS Certificate Problems
Symptom: Browser shows certificate errors; HTTPS doesn’t work.
Check 1: Traefik logs
docker compose logs traefik | grep -i acme
Look for Let’s Encrypt errors.
Check 2: DNS resolution
dig +short YOUR_DOMAIN
Must resolve to your server’s public IP.
Check 3: Ports 80/443 accessible
Let’s Encrypt needs to reach port 80 for verification:
# From external host
curl http://YOUR_DOMAIN/.well-known/acme-challenge/test
Check 4: Rate limits
Let’s Encrypt has rate limits. If exceeded, wait an hour and retry.
For testing, use Let’s Encrypt staging:
In docker-compose.yml:
traefik:
  command:
    - "--certificatesresolvers.letsencrypt.acme.caserver=https://acme-staging-v02.api.letsencrypt.org/directory"
Syslog TLS Issues
Symptom: TLS connections to port 6514 fail.
Check 1: TLS is enabled and configured
# Get install directory
INSTALL_DIR=${INSTALL_DIR:-/opt/rosi-collector}

# Check .env settings
grep SYSLOG_TLS $INSTALL_DIR/.env

# Verify certificates exist
ls -la $INSTALL_DIR/certs/
Check 2: Test TLS handshake
INSTALL_DIR=${INSTALL_DIR:-/opt/rosi-collector}
openssl s_client -connect localhost:6514 -CAfile $INSTALL_DIR/certs/ca.pem
Look for “Verify return code: 0 (ok)”. Common errors:
“unable to get local issuer certificate” - CA cert not found
“certificate verify failed” - Hostname mismatch or expired cert
Check 3: rsyslog TLS configuration
docker compose logs rsyslog | grep -i tls
docker compose logs rsyslog | grep -i ossl
Check 4: Port 6514 is exposed
# Check if TLS profile is enabled in systemd service
systemctl cat rosi-collector.service | grep ExecStart

# Check port binding
ss -tlnp | grep 6514

# Check SYSLOG_TLS_ENABLED in .env (should be true for TLS)
grep SYSLOG_TLS_ENABLED ${INSTALL_DIR:-/opt/rosi-collector}/.env

# Restart the stack
cd ${INSTALL_DIR:-/opt/rosi-collector}
docker compose up -d
Check 5: Client certificate issues (mTLS)
For x509/certvalid or x509/name modes:
# Test with client cert
openssl s_client -connect COLLECTOR:6514 \
    -CAfile /etc/rsyslog.d/certs/ca.pem \
    -cert /etc/rsyslog.d/certs/client-cert.pem \
    -key /etc/rsyslog.d/certs/client-key.pem
Common mTLS errors:
“peer did not return a certificate” - Client cert not sent
“certificate verify failed” - Client cert not signed by CA
“alert handshake failure” - For x509/name, CN doesn’t match PERMITTED_PEERS
Check 6: Certificate expiry
INSTALL_DIR=${INSTALL_DIR:-/opt/rosi-collector}

# Server certs
openssl x509 -in $INSTALL_DIR/certs/ca.pem -noout -dates
openssl x509 -in $INSTALL_DIR/certs/server-cert.pem -noout -dates

# Client certs (on client)
openssl x509 -in /etc/rsyslog.d/certs/client-cert.pem -noout -dates
Regenerate certificates
If certificates are corrupted or expired:
INSTALL_DIR=${INSTALL_DIR:-/opt/rosi-collector}

# Force regeneration
sudo rosi-generate-ca --force --dir $INSTALL_DIR/certs \
    --hostname logs.example.com

# Restart rsyslog
docker compose restart rsyslog
Performance Issues
Symptom: Queries are slow; Grafana times out.
Loki Query Optimization
Use labels to filter before full-text search
Reduce time range for initial exploration
Add
| line_formatat end to reduce parsing
Instead of:
{job="syslog"} |= "error"
Use:
{job="syslog", host="specific-host"} |= "error"
Memory Tuning
Loki benefits from more memory. In docker-compose.yml:
loki:
  deploy:
    resources:
      limits:
        memory: 4G
Prometheus Cardinality
High-cardinality labels slow queries. Check:
curl http://localhost:9090/api/v1/status/tsdb | jq .data.seriesCountByMetricName
High Alert Volume
Symptom: Too many alerts firing.
Adjust thresholds in grafana/provisioning/alerting/default.yml
Add silences for known issues:
Go to Grafana → Alerting → Silences
Create silence matching the alert labels
Set duration
Client Queue Backup
Symptom: Client’s rsyslog queue files growing.
Check 1: Collector reachable
telnet COLLECTOR_IP 10514
Check 2: rsyslog status
sudo systemctl status rsyslog
journalctl -u rsyslog -n 50
Check 3: Queue configuration
Increase queue size in client config:
$ActionQueueMaxDiskSpace 2g
$ActionQueueLowWaterMark 2000
$ActionQueueHighWaterMark 8000
Getting Help
If these steps don’t resolve your issue:
Gather logs:
docker compose logs > collector-logs.txtCheck rsyslog GitHub issues
Ask on the rsyslog mailing list with log excerpts
See Also
Troubleshooting - General rsyslog troubleshooting
Support: rsyslog Assistant | GitHub Discussions | GitHub Issues: rsyslog source project
Contributing: Source & docs: rsyslog source project
© 2008–2025 Rainer Gerhards and others. Licensed under the Apache License 2.0.