Client Setup
This guide explains how to configure client hosts to send logs and metrics to your ROSI Collector. Each client needs rsyslog configured for log forwarding and optionally node_exporter for system metrics.
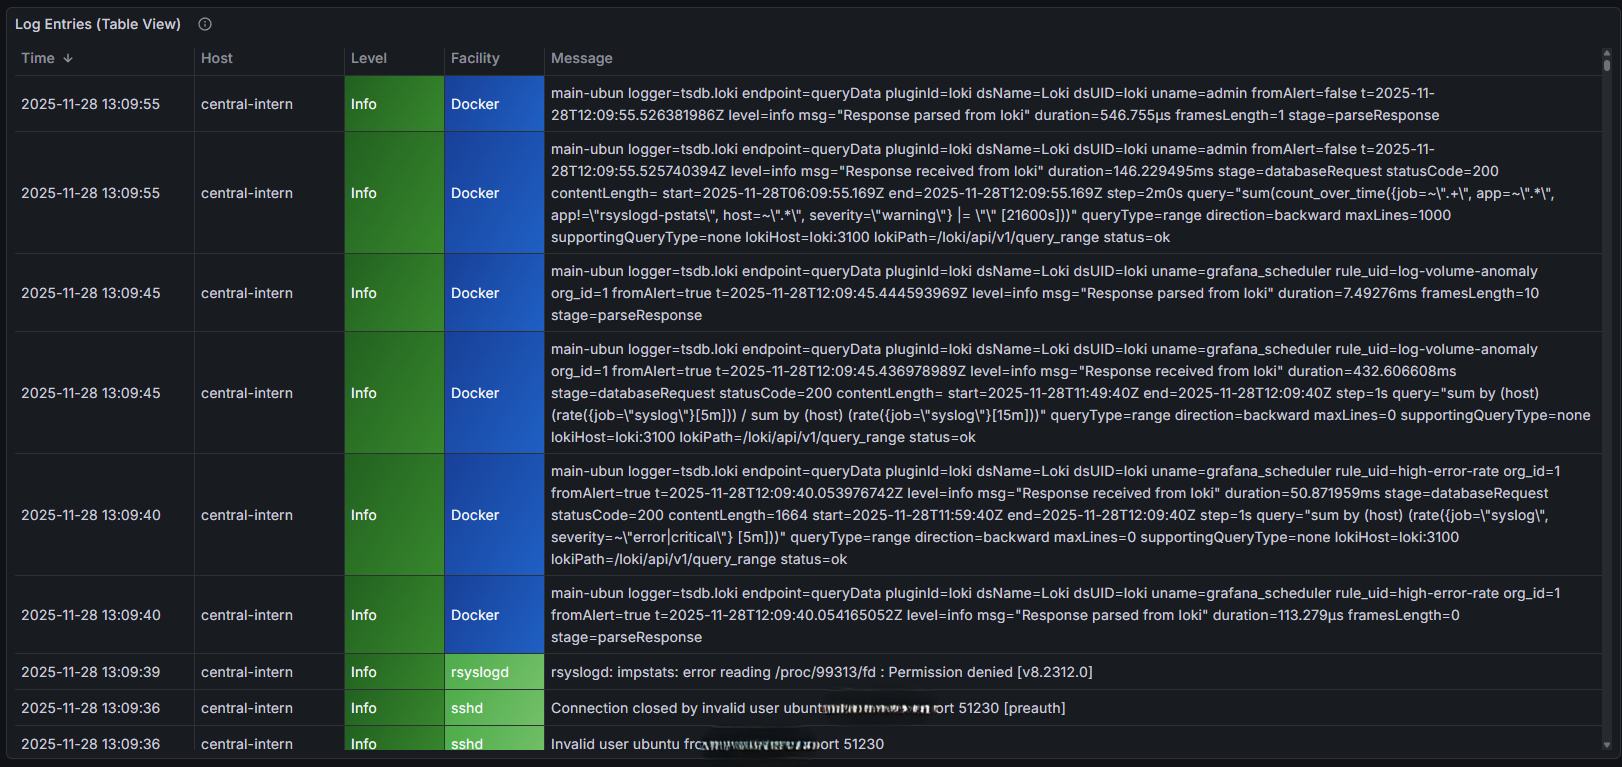
Client logs visible in Grafana Syslog Explorer
Overview
Client configuration involves:
rsyslog - Forward logs to the collector (TCP port 10514)
node_exporter - Expose metrics for Prometheus (port 9100)
Collector registration - Add client to Prometheus targets
Quick Setup (Automated)
Download and run the setup scripts from your ROSI Collector:
rsyslog Client
# Download from your collector's downloads container
wget https://YOUR_COLLECTOR_DOMAIN/downloads/install-rsyslog-client.sh
chmod +x install-rsyslog-client.sh
sudo ./install-rsyslog-client.sh
Node Exporter
wget https://YOUR_COLLECTOR_DOMAIN/downloads/install-node-exporter.sh
chmod +x install-node-exporter.sh
sudo ./install-node-exporter.sh
Replace YOUR_COLLECTOR_DOMAIN with your ROSI Collector’s base domain
(the same value as TRAEFIK_DOMAIN in your .env file).
Manual Setup: rsyslog
If you prefer manual configuration, follow these steps.
Step 1: Install rsyslog
Most Linux distributions include rsyslog by default. Verify it’s installed:
rsyslogd -v
# rsyslogd  8.2302.0 (aka 2023.02) ...
If not installed:
# Debian/Ubuntu
sudo apt install rsyslog

# RHEL/CentOS/Rocky
sudo dnf install rsyslog
Step 2: Configure Forwarding
Create a forwarding configuration file:
sudo nano /etc/rsyslog.d/60-forward-to-collector.conf
Add this configuration:
# Forward all logs to ROSI Collector
# Replace COLLECTOR_IP with your collector's IP or hostname

# Use queue for reliable delivery
$ActionQueueType LinkedList
$ActionQueueFileName collector-queue
$ActionQueueMaxDiskSpace 1g
$ActionQueueSaveOnShutdown on
$ActionResumeRetryCount -1

# Forward to collector
*.* @@COLLECTOR_IP:10514
Replace COLLECTOR_IP with your ROSI Collector’s IP address or hostname.
Step 3: Restart rsyslog
sudo systemctl restart rsyslog
Step 4: Test Forwarding
Send a test message:
logger "Test message from $(hostname)"
Check Grafana’s Explore interface to verify the message arrived.
Manual Setup: rsyslog with TLS
For encrypted log transport, configure TLS on port 6514. This requires the collector to have TLS enabled (see Installation).
Step 1: Install rsyslog-openssl
The OpenSSL network stream driver is required:
# Debian/Ubuntu
sudo apt install rsyslog-openssl

# RHEL/CentOS/Rocky
sudo dnf install rsyslog-openssl
Step 2: Get CA Certificate
Download the CA certificate from your collector:
# Download CA cert from the downloads container
sudo mkdir -p /etc/rsyslog.d/certs
sudo wget -O /etc/rsyslog.d/certs/ca.pem \
    https://YOUR_COLLECTOR_DOMAIN/downloads/ca.pem
For mTLS, get your client certificate package from the admin and install it:
# Download one-time package (URL from admin)
wget https://YOUR_COLLECTOR_DOMAIN/downloads/tls-packages/CLIENT_TOKEN.tar.gz

# Extract and install
tar xzf CLIENT_TOKEN.tar.gz
cd CLIENT_NAME
sudo ./install.sh
Step 3: Configure TLS Forwarding
Create a TLS forwarding configuration:
sudo nano /etc/rsyslog.d/60-forward-tls.conf
For server-only auth (anon mode):
# TLS settings - OpenSSL driver loads automatically
global(
    workDirectory="/var/spool/rsyslog"
    DefaultNetstreamDriver="ossl"
    DefaultNetstreamDriverCAFile="/etc/rsyslog.d/certs/ca.pem"
)

# Forward all logs via TLS
*.* action(
    type="omfwd"
    target="COLLECTOR_HOSTNAME"
    port="6514"
    protocol="tcp"
    StreamDriver="ossl"
    StreamDriverMode="1"
    StreamDriverAuthMode="anon"
    queue.type="LinkedList"
    queue.size="10000"
    queue.filename="fwd_tls"
    queue.saveOnShutdown="on"
    action.resumeRetryCount="-1"
)
For mutual TLS (x509/certvalid or x509/name):
# TLS settings with client certificate
global(
    workDirectory="/var/spool/rsyslog"
    DefaultNetstreamDriver="ossl"
    DefaultNetstreamDriverCAFile="/etc/rsyslog.d/certs/ca.pem"
    DefaultNetstreamDriverCertFile="/etc/rsyslog.d/certs/client-cert.pem"
    DefaultNetstreamDriverKeyFile="/etc/rsyslog.d/certs/client-key.pem"
)

# Forward all logs via mTLS
*.* action(
    type="omfwd"
    target="COLLECTOR_HOSTNAME"
    port="6514"
    protocol="tcp"
    StreamDriver="ossl"
    StreamDriverMode="1"
    StreamDriverAuthMode="x509/name"
    queue.type="LinkedList"
    queue.size="10000"
    queue.filename="fwd_tls"
    queue.saveOnShutdown="on"
    action.resumeRetryCount="-1"
)
Replace COLLECTOR_HOSTNAME with your collector’s hostname.
Step 4: Restart rsyslog
sudo systemctl restart rsyslog
Step 5: Test TLS Connection
# Test TLS handshake
openssl s_client -connect COLLECTOR_HOSTNAME:6514 \
    -CAfile /etc/rsyslog.d/certs/ca.pem

# Send test message
logger "TLS test from $(hostname)"
Manual Setup: Node Exporter
Node exporter provides system metrics (CPU, memory, disk, network) to Prometheus.
Step 1: Download Node Exporter
# Get latest version
VERSION=$(curl -s https://api.github.com/repos/prometheus/node_exporter/releases/latest | grep tag_name | cut -d '"' -f 4 | tr -d 'v')

wget https://github.com/prometheus/node_exporter/releases/download/v${VERSION}/node_exporter-${VERSION}.linux-amd64.tar.gz
tar xzf node_exporter-${VERSION}.linux-amd64.tar.gz
sudo mv node_exporter-${VERSION}.linux-amd64/node_exporter /usr/local/bin/
Step 2: Create Systemd Service
sudo tee /etc/systemd/system/node_exporter.service << 'EOF'
[Unit]
Description=Prometheus Node Exporter
After=network.target

[Service]
User=nobody
ExecStart=/usr/local/bin/node_exporter
Restart=always

[Install]
WantedBy=multi-user.target
EOF
Step 3: Start Service
sudo systemctl daemon-reload
sudo systemctl enable --now node_exporter
Step 4: Configure Firewall
Allow your ROSI Collector to scrape metrics:
sudo ufw allow from COLLECTOR_IP to any port 9100 proto tcp
Replace COLLECTOR_IP with your collector’s IP address.
Step 5: Verify
curl http://localhost:9100/metrics | head
Register Client on Collector
After configuring the client, add it to Prometheus targets on your
ROSI Collector server using the prometheus-target CLI tool:
# SSH to your ROSI Collector, then:
prometheus-target add CLIENT_IP:9100 host=CLIENT_HOSTNAME role=ROLE [network=NETWORK]
Example:
prometheus-target add 10.0.0.50:9100 host=webserver-01 role=web network=production
Available commands:
prometheus-target add <IP:PORT> host=<name> [role=<value>] [network=<value>]
prometheus-target list
prometheus-target remove <IP:PORT>      # Remove by IP:port
prometheus-target remove <hostname>     # Remove by hostname
Available labels:
host(required) - Hostname for identificationrole- Server role (web, db, app, etc.)network- Network zone (internal, dmz, production)env- Environment (prod, staging, dev)Any custom
key=valuelabel
List all targets:
prometheus-target list
Remove a target (either by IP:port or hostname):
prometheus-target remove 10.0.0.50:9100
# or
prometheus-target remove webserver-01
Prometheus picks up changes within 5 minutes automatically.
Verification
Test Log Forwarding
# On client
logger "Hello from $(hostname)"

# On collector (or via Grafana)
# Search for the message in Syslog Explorer
Test Metrics Collection
Go to Grafana → Node Overview dashboard
Select your client from the host dropdown
Verify CPU, memory, and disk metrics appear
Check Connection Status
On the client, verify rsyslog queue status:
sudo cat /var/spool/rsyslog/collector-queue*
An empty or missing queue indicates messages are flowing.
Troubleshooting
Logs not appearing
Check rsyslog status:
sudo systemctl status rsyslogTest connectivity:
telnet COLLECTOR_IP 10514Check queue directory:
ls -la /var/spool/rsyslog/
Metrics not appearing
Check node_exporter:
sudo systemctl status node_exporterTest locally:
curl http://localhost:9100/metricsCheck firewall:
sudo ufw status
See also: Troubleshooting
Next Steps
Grafana Dashboards - Explore log data in dashboards
Troubleshooting - Solve common problems
Support: rsyslog Assistant | GitHub Discussions | GitHub Issues: rsyslog source project
Contributing: Source & docs: rsyslog source project
© 2008–2025 Rainer Gerhards and others. Licensed under the Apache License 2.0.