Grafana Dashboards
ROSI Collector includes pre-built Grafana dashboards for exploring logs and monitoring system health. This guide explains each dashboard and how to use them effectively.
Dashboard Overview
ROSI Collector provisions five dashboards:
Dashboard |
Purpose |
|---|---|
Syslog Explorer |
Search and browse logs from all hosts |
Syslog Deep Dive |
Detailed analysis of log patterns |
Node Overview |
System metrics (CPU, memory, disk, network) |
Client Health |
rsyslog client status and statistics |
Alerting Overview |
Active alerts and notification status |
Syslog Explorer
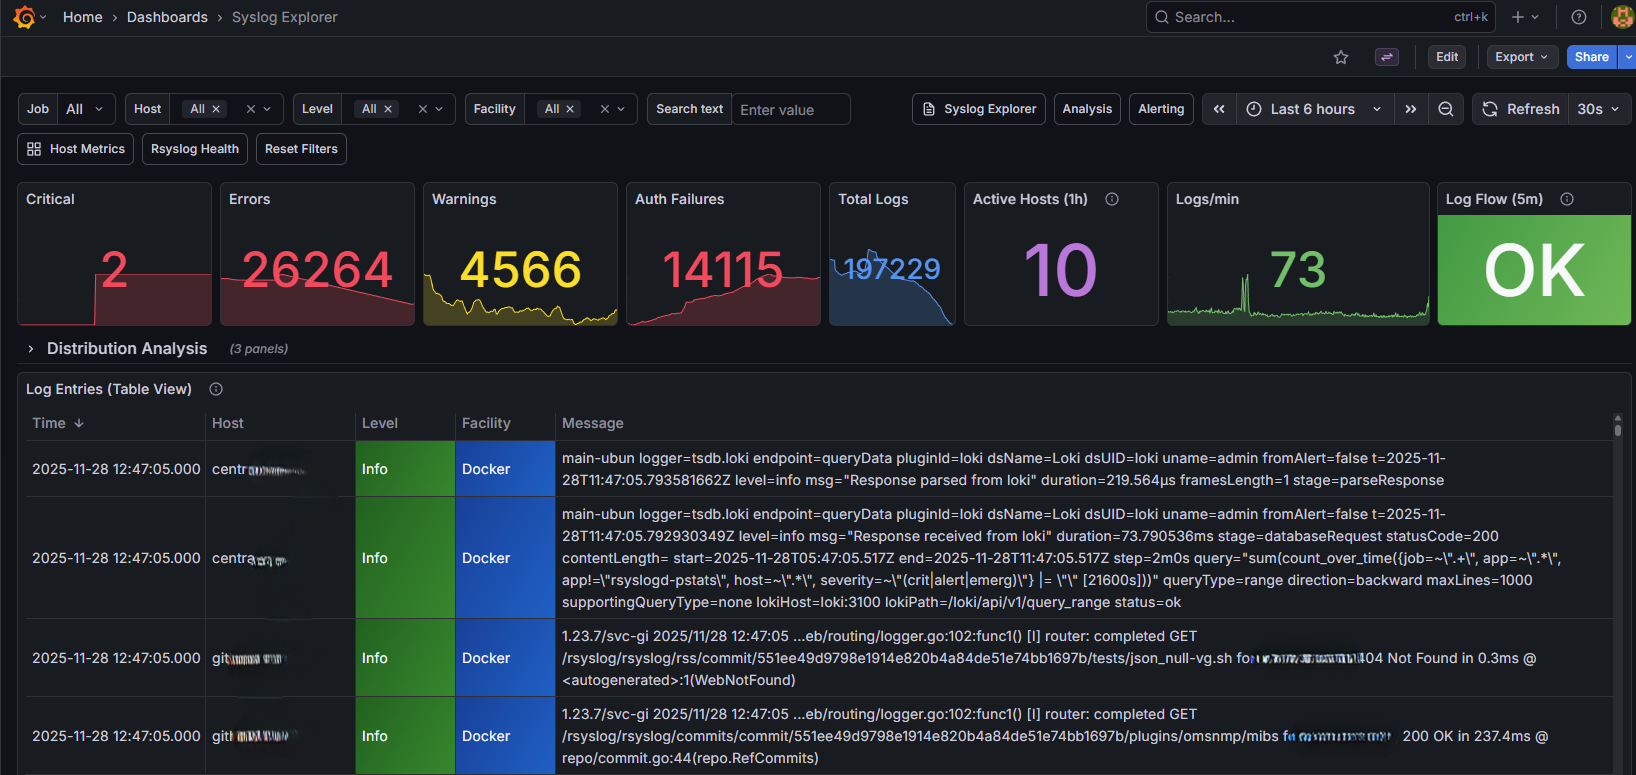
Syslog Explorer dashboard for browsing and searching logs
The Syslog Explorer is your primary interface for searching logs. It provides:
Time range selector - Choose the time window for your search
Host filter - Limit results to specific hosts
Severity filter - Filter by syslog severity (err, warning, info, etc.)
Facility filter - Filter by syslog facility (auth, daemon, etc.)
Log table - Browse log entries with timestamp, host, and message
Common searches:
All errors: Set severity to
errAuthentication events: Set facility to
authSpecific host: Select from host dropdown
Using LogQL for advanced queries:
Click “Explore” in the left sidebar and use LogQL queries:
# Find SSH failures
{job="syslog"} |= "Failed password"

# Errors from specific host
{host="webserver-01"} | json | severity = "err"

# Count errors by host
sum by (host) (count_over_time({job="syslog"} | json | severity = "err" [5m]))
Syslog Deep Dive
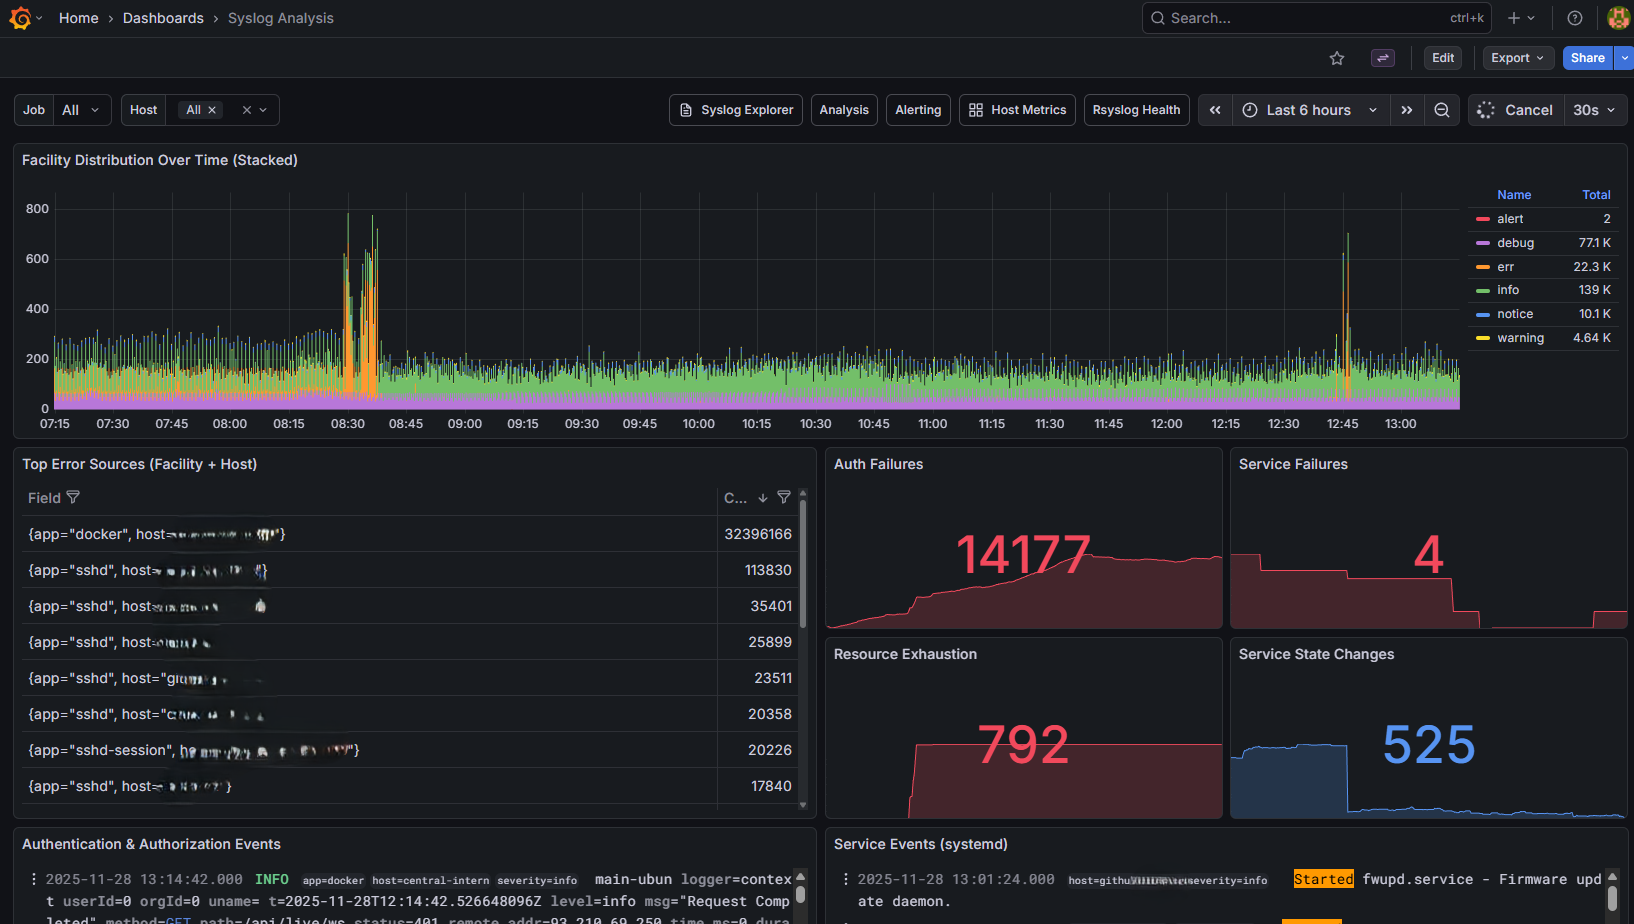
Syslog Deep Dive dashboard for log analysis
This dashboard provides analytical views of log data:
Log volume graph - Messages over time
Severity breakdown - Pie chart of log severities
Top hosts - Hosts generating the most logs
Error trends - Error count over time
Use this dashboard to:
Identify hosts with unusual log volumes
Track error rates over time
Find the most common error messages
Node Overview
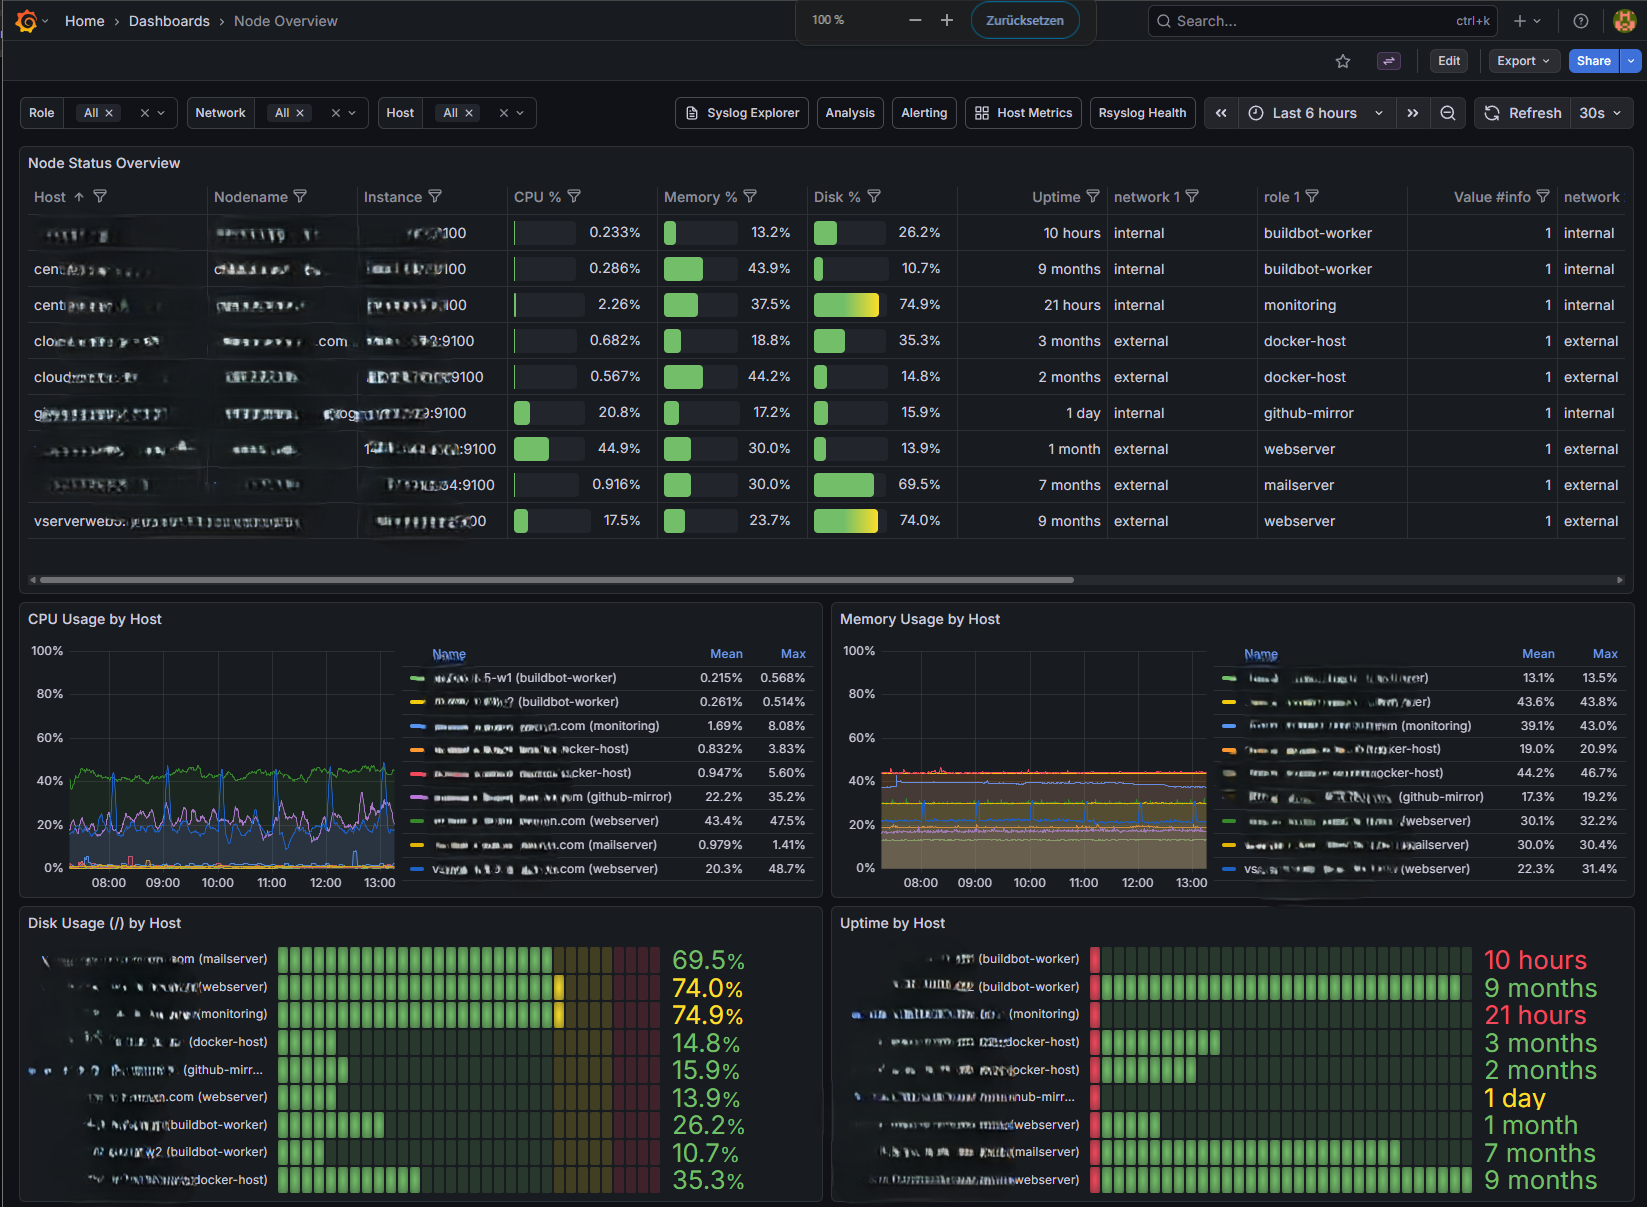
Node Overview showing system metrics
The Node Overview shows system metrics from node_exporter:
CPU usage - Per-core and total utilization
Memory - Used, available, and cached
Disk I/O - Read/write throughput
Network - Bytes in/out per interface
Disk space - Usage by filesystem
Select a host from the dropdown to view its metrics. Time range applies to all panels.
Key metrics to watch:
CPU usage sustained above 80%
Memory usage approaching 100%
Disk usage above 80%
Network errors or drops
Alerting Overview
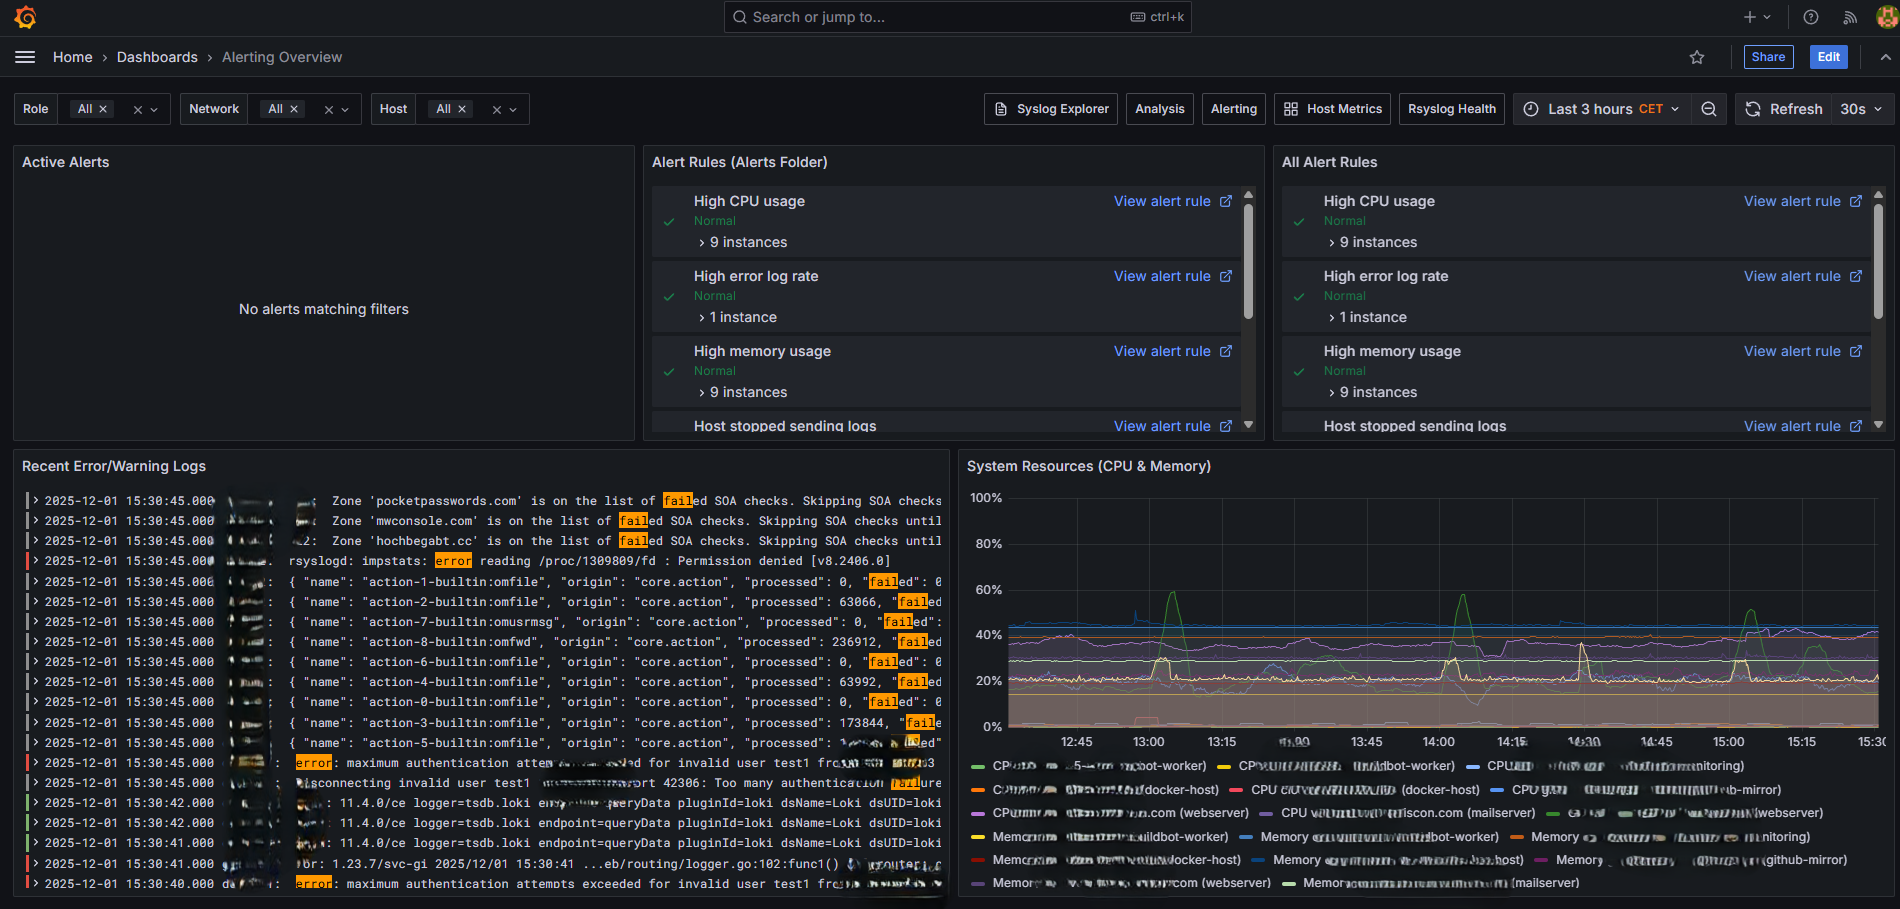
Alerting Overview dashboard for monitoring alert status
View active alerts and notification status:
Firing alerts - Currently active alerts
Alert history - Recent alert state changes
Silence status - Active silences
Creating Custom Dashboards
You can create your own dashboards in Grafana:
Click the + icon in the left sidebar
Select New Dashboard
Add panels using Loki (logs) or Prometheus (metrics) as data source
Loki query examples:
# Count logs by host
sum by (host) (count_over_time({job="syslog"}[5m]))

# Specific application logs
{job="syslog", host="appserver"} |= "myapp"

# Parse and filter
{job="syslog"} | pattern "<_> <_> <_> <facility>.<severity> <message>" | severity = "err"
Prometheus query examples:
# CPU usage percentage
100 - (avg by (instance) (irate(node_cpu_seconds_total{mode="idle"}[5m])) * 100)

# Memory usage
(node_memory_MemTotal_bytes - node_memory_MemAvailable_bytes) / node_memory_MemTotal_bytes * 100

# Disk usage
100 - ((node_filesystem_avail_bytes / node_filesystem_size_bytes) * 100)
Exporting Dashboards
To backup or share dashboards:
Open the dashboard
Click the gear icon (Dashboard settings)
Select JSON Model
Copy the JSON and save it
Or use the API:
curl -s http://localhost:3000/api/dashboards/db/syslog-explorer \
  -H "Authorization: Bearer YOUR_API_KEY" | jq .
Dashboard Best Practices
For log exploration:
Start with a narrow time range
Use filters to reduce result set
Export to CSV for offline analysis
For monitoring:
Set appropriate alert thresholds
Use template variables for host selection
Create summary panels for quick status
For performance:
Avoid queries spanning more than 24 hours on busy systems
Use labels to filter before pattern matching
Limit log line display count
See Also
Support: rsyslog Assistant | GitHub Discussions | GitHub Issues: rsyslog source project
Contributing: Source & docs: rsyslog source project
© 2008–2025 Rainer Gerhards and others. Licensed under the Apache License 2.0.